Page 22 - 南京医科大学自然版
P. 22

第44卷第4期
               ·460 ·                            南 京    医 科 大 学 学         报                        2024年4月


                           A                                              B
                                         WT                 p53 +/-
                                                                              30           *
                                                                              (#/mm 2 )  20    #


                                                                              N.Oc/T.Ar  10

                              TRAP   1α(OH)ase -/-     1α(OH)ase p53 +/-
                                                               -/-
                                                                               0
                                                                                  WT  p53 +/-  ase -/-  -/-  p53 +/-
                                                                                       (OH)
                                                                                     1α (OH)  ase
                                                                                      1α


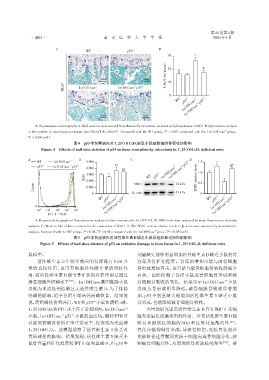
                 A:Representative micrographs of tibial sections were stained histochemically for tartrate⁃resistant acid phosphatase(×400). B:Quantitative analysis
              of the number of osteoclasts per tissue area(N.Oc/T.Ar,#/mm ). Compared with the WT group,P < 0.05;compared with the 1α(OH)ase group,
                                                                                                         ⁃/⁃
                                                                             *
                                                      2
              #
              P < 0.05(n=5).
                                   图4 p53半剂量缺失对1,25(OH)D3缺乏小鼠破骨细胞骨吸收的影响
                                                              2
                    Figure 4 Effects of half⁃dose deletion of p53 on bone resorption by osteoclasts in 1,25(OH)D3 deficient mice
                                                                                           2
              A                       B                      C                         +/- D
                  WT      1α(OH)ase -/-  5 000                                              1.5      *
                                 -/-
                  p53 +/-  1α(OH)ase p53 +/-          **                         -/-  -/-  p53             #*
                                         4 000
                                                                                (OH)
                                                         #*                  (OH) ase  ase  1.0
                                        ROS  3 000  *                WT  p53 +/-  1α  1α    SOD1 relative levels
                                         2 000                                    18 kDa    0.5         *
                 Count                   1 000                 SOD1
                                            0                 β⁃actin             43 kDa      0
                                               WT  p53 +/-  ase -/- -/-  p53 +/-                 WT  p53 +/-  ase -/-  -/-  p53 +/-
                 0                               1α (OH)  ase                                      1α (OH)  ase
                  10 0  10 1  10 2  10 3  10 4    (OH)                                              (OH)
                       FL1⁃1∶∶ROS                 1α                                                1α
                 A:Representative graphs of flow cytometry analysis of bone marrow cells for DCF⁃DA. B:ROS levels were assessed by mean fluorescence intensity
              analysis. C:Western blot of bone extracts for the expression of SOD1. D:The SOD1 protein relative levels to β⁃actin were assessed by densitometric
                                              **
                                                                              #
                                                                        -/-
                                       *
              analysis. Compared with the WT group,P < 0.05,P < 0.01;compared with the 1α(OH)ase group,P < 0.05(n=5).
                                   图5 p53半剂量缺失对活性维生素D缺乏小鼠骨组织氧化损伤的影响
                   Figure 5 Effects of half⁃dose deletion of p53 on oxidative damage to bone tissue in 1,25(OH)D3 deficient mice
                                                                                            2
              鼠模型。                                              剂量缺失能够明显增加活性维生素D缺乏小鼠的骨
                  活性维生素 D 生物学效应的发挥既有 VDR 介                      容量及骨矿化程度。骨量的增加可能与成骨细胞
              导的直接作用,也可有细胞外钙磷介导的间接作                             骨形成增加有关,也可能与破骨细胞骨吸收的减少
              用,而活性维生素 D 调节骨矿化的经典作用是通过                          有关。因此检测了各组小鼠成骨细胞骨形成和破
              提高细胞外钙磷水平          [22] 。1α(OH)ase基因敲除小鼠          骨细胞骨吸收的变化。结果显示1α(OH)ase 小鼠
                                                                                                         -/-
              表现为血清低钙低磷且无活性维生素 D,为了排除                           表现为骨形成明显降低,破骨细胞骨吸收显著增
              钙磷的影响,给予各组小鼠高钙高磷饮食。结果发                            加,p53 半剂量缺失能增加活性维生素 D 缺乏小鼠
              现,高钙磷饮食喂养后,WT和p53 小鼠血清钙、磷、                        骨形成,也能降低破骨细胞骨吸收。
                                            +/-
              1,25(OH) 2D3和PTH水平在正常范围内;1α(OH)ase           -/-       大量的研究证实活性维生素D具有保护正常细
              小鼠、1α(OH)ase p53 小鼠的血清钙、磷和PTH可                    胞免受氧化应激攻击的作用。补充活性维生素D能
                             -/-
                                  +/-
              以被高钙磷饮食矫正至正常水平,仅表现为无血清                            够显著提高红细胞的 SOD 和过氧化氢酶活性                     [23] 。
              1,25(OH) 2D3。此模型观察了活性维生素 D 缺乏对                    氧化应激抑制骨形成,导致骨损伤,而抗氧化剂补
              骨质疏松的影响。结果发现:活性维生素 D 缺乏小                          充能够促进骨髓间充质干细胞向成骨细胞分化,抑
              鼠骨容量和矿化程度较WT小鼠明显减少,但p53半                          制破骨细胞活性,从而预防骨质疏松的发生                     [24] 。研
   17   18   19   20   21   22   23   24   25   26   27