
Page 56 - 南京医科大学自然版
P. 56
第44卷第4期
·494 · 南 京 医 科 大 学 学 报 2024年4月
(E/A和e’较低,E/e’较高)更差(Ptrend < 0.01)。 2.3 连续变量分析cIMT与左心室收缩及舒张功能
2.2 分类变量分析cIMT与左心室收缩及舒张功能 的关系
的关系 将cIMT自然对数转换后进行连续性分析,结果
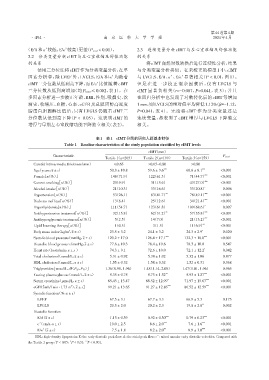
使用三分位法将cIMT作为分类变量分析,在单 与分类变量分析类似。在未校正的模型 1 中,cIMT
因素分析中,除 LVEF 外,LVGLS,E/A 和 e’均随着 与 LVGLS、E/A、e’、E/e’显著相关(P < 0.01,图 1)。
cIMT三分位数从低到高下降,而E/e’比值随着 cIMT 但是在进一步校正混杂因素后,仅有 LVGLS 与
三分位数从低到高增加(均 Ptrend ≤ 0.002,表 1)。在 cIMT 显著负相关(r=-0.087,P=0.041,表 3);并且
多因素分析进一步校正年龄、BMI、性别、吸烟史、饮 在回归分析中也发现了对数转化后的 cIMT 每增加
酒史、收缩压、血糖、心率、eGFR 及总胆固醇高密度 1 mm,则LVGLS的绝对值平均降低1.12%(β=-1.12,
脂蛋白胆固醇比值后,只有 LVGLS 仍随着 cIMT 三 P=0.041,表 4)。无论将 cIMT 作为分类变量还是
分位数从低到高下降(P < 0.05)。这表明 cIMT 的 连续变量,都表明了 cIMT 增厚与 LVGLS 下降独立
增厚与早期左心室收缩功能下降独立相关(表2)。 相关。
表1 表1 cIMT分层的研究人群基本特征
Table 1 Baseline characteristics of the study population stratified by cIMT levels
cIMT(mm)
Characteristic Ptrend
Tertile 1(n=203) Tertile 2(n=199) Tertile 3(n=159)
Carotid intima⁃media thickness(mm) ≤0.65 >0.65-0.80 >0.80
Age(years,x ± s) 50.3 ± 10.8 59.6 ± 9.6 *** 66.6 ± 8.1 *** <0.001
Female[n(%)] .146(71.9) .122(61.3) 0.71(44.7) *** <0.001
Current smoking[n(%)] 0.20(9.9) .031(15.6) 0.43(27.0) *** <0.001
Alcohol intake[n(%)] 0.21(10.3) .033(16.6) 0.33(20.8) * 0.006
Hypertension[n(%)] 0.53(26.1) .083(41.7) ** 0.78(49.1) *** <0.001
Diabetes mellitus[n(%)] 0.13(6.4) .025(12.6) 0.34(21.4) *** <0.001
Hyperlipidemia[n(%)] .111(54.7) .123(61.8) .109(68.6) * 0.007
Antihypertensive treatment[n(%)] 0.32(15.8) .062(31.2) ** 0 .57(35.8) *** <0.001
Antihyperglycemic treatment[n(%)] 0.05(2.5) .014(7.0) 0 .21(13.2) *** <0.001
Lipid lowering therapy[n(%)] 0.01(0.5) .003(1.5) 0.11(6.9) ** <0.001
Body mass index(kg/m ,x ± s) 23.5 ± 3.20 24.1 ± 3.2 0 24.3 ± 2.9 *** 0.020
2
a
Systolic blood pressure(mmHg,x ± s) 120.2 ± 17.00 126.4 ± 17.1 *** 132.3 ± 18.8 *** <0.001
Diastolic blood pressure(mmHg,x ± s) 77.6 ± 10.3 78.4 ± 10.6 a 78.3 ± 10.0 b 0.547
Heart rate(beats/min,x ± s ) 74.3 ± 9.10 72.6 ± 10.0 a 72.1 ± 12.2 * 0.042
Total cholesterol(mmol/L,x ± s) 5.31 ± 0.92 5.38 ± 1.02 a 5.32 ± 1.06 b 0.877
HDL cholesterol(mmol/L,x ± s) 1.55 ± 0.32 1.58 ± 0.32 a 1.52 ± 0.31 b 0.368
Triglycerides[mmol/L,M(P25,P75)] 1.36(0.98,1.96) 1.48(1.14,2.08) 1.47(1.01,1.96) 0.965
Fasting plasma glucose(mmol/L,x ± s) 5.35 ± 0.75 5.73 ± 1.32 ** 5.93 ± 1.27 *** <0.001
Serum creatinine(μmol/L,x ± s) 65.45 ± 13.47 68.52 ± 12.99 * 71.97 ± 15.67 *** <0.001
eGFR[mL/(min·1.73 m ),x ± s] 99.21 ± 13.65 91.27 ± 12.86 *** 86.52 ± 12.59 *** <0.001
2
Systolic function(%,x ± s)
a
0
LVEF 67.5 ± 3.10 67.7 ± 3.3 0 66.9 ± 5.3 0 0.175
a ***
LVGLS 20.5 ± 2.00 20.2 ± 2.3 0 19.8 ± 2.8 0.002
Diastolic function
E/A(x ± s) 1.13 ± 0.39 0.92 ± 0.30 *** 0.79 ± 0.23 *** <0.001
e’(cm/s,x ± s) 10.0 ± 2.50 8.6 ± 2.0 *** 7.6 ± 1.6 *** <0.001
E/e’(x ± s) 7.5 ± 1.8 8.2 ± 2.0 ** 8.9 ± 3.0 *** <0.001
HDL:high⁃density lipoprotein;E:the early diastolic peak flow;A:the atrial peak flow;e’:mitral annular early diastolic velocities. Compared with
*
**
***
the Tertile 1 group,P < 0.05,P < 0.01, P < 0.001.