
Page 58 - 南京医科大学自然版
P. 58
第44卷第4期
·496 · 南 京 医 科 大 学 学 报 2024年4月
A B
70
60 20
(%) (%)
LVEF 50 LVGLS
40
r=-0.043 r=-0.133
10
P=0.313 P=0.002
30
-1.0 -0.5 0 0.5 -1.0 -0.5 0 0.5
lncIMT(mm) lncIMT(mm)
C D E
2.5 25
r=-0.459 r=-0.470 r=-0.246
P < 0.001 P < 0.001 P < 0.001
15
2.0 20
e’cm/s) 12 E/e’ 15
1.5
E/A (
1.0 9
10
6
0.5
5
-1.0 -0.5 0 0.5 -1.0 -0.5 0 0.5 -1.0 -0.5 0 0.5
lncIMT(mm) lncIMT(mm) lncIMT(mm)
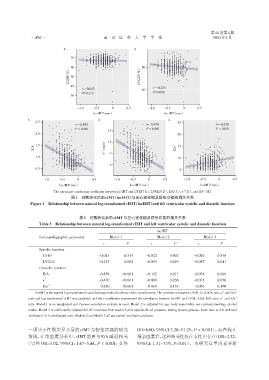
The univariate correlation coefficient between lncIMT and LVEF(A),LVGLS(B),E/A(C),e’(D),and E/e’(E).
图1 对数转化后的cIMT(lncIMT)与左心室收缩及舒张功能的相关关系
Figure 1 Relationship between natural log⁃transformed cIMT(lncIMT)and left ventricular systolic and diastolic function
表3 对数转化后的cIMT与左心室收缩及舒张功能的相关关系
Table 3 Relationship between natural log⁃transformed cIMT and left ventricular systolic and diastolic function
lncIMT
Echocardiographic parameter Model 1 Model 2 Model 3
r P r P r P
Systolic function
LVEF -0.043 0.313 -0.022 0.603 -0.026 0.538
LVGLS -0.133 0.002 -0.093 0.029 -0.087 0.041
Diastolic function
E/A -0.459 <0.001 -0.102 0.017 -0.078 0.068
e’ -0.470 <0.001 -0.089 0.036 -0.071 0.096
E/e’ 0.246 <0.001 0.064 0.133 0.056 0.190
lncIMT is the natural log⁃transformed carotid intima⁃media thickness of the carotid artery. The correlation between LVEF,GLS,E/A ratio,e’and E/e’
ratio and log⁃transformed cIMT was analyzed,and the r⁃coefficient represented the correlation between lncIMT and LVEF,GLS,E/A ratio,e’and E/e’
ratio. Model 1 is an unadjusted and Pearson correlation analysis is used. Model 2 is adjusted for age,body mass index,sex,current smoking,alcohol
intake. Model 3 is additionally adjusted for all covariates from model 2 plus systolic blood pressure,fasting plasma glucose,heart rate,eGFR and total
cholesterol HDL⁃cholesterol ratio. Models 2 and Model 3 all use partial correlation analysis.
一项基于性别差异开展的 cIMT 与舒张功能的研究 OR=6.00,95%CI:3.20~11.25,P < 0.001),而在校正
发现,在单因素分析中,cIMT 增厚与 E/A 减退相关 混杂因素后,这种相关性仅在女性中存在(OR=3.22,
(男性 OR=3.02,95%CI:1.67~5.44,P < 0.001;女性 95%CI:1.31~7.95,P=0.01)。本研究在单因素分析