
Page 69 - 南京医科大学自然版
P. 69
第44卷第4期 朱家敏,王姗姗,诸清逸,等. 妊娠期糖尿病孕妇孕前正常体重指数与妊娠结局的相关性[J].
2024年4月 南京医科大学学报(自然科学版),2024,44(04):505-510 ·507 ·
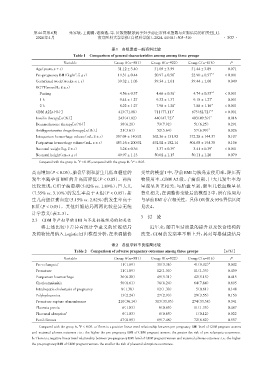
表1 各组患者一般资料比较
Table 1 Comparison of general characteristics among among three groups
Variable Group A(n=581) Group B(n=922) Group C(n=816) P
Age(years,x ± s) 31.12 ± 3.40 31.05 ± 3.59 31.44 ± 3.89 0.071
Pre⁃pregnancy BMI(kg/m ,x ± s) 19.31 ± 0.44 20.97 ± 0.56 * 22.90 ± 0.57 *△ < 0.001
2
Gestational week(weeks,x ± s) 39.32 ± 1.03 39.34 ± 1.01 39.44 ± 1.00 0.049
OGTT(mmol/L,x ± s)
Fasting 04.56 ± 0.37 0 4.66 ± 0.36 * 0 4.74 ± 0.35 *△ < 0.001
1 h 09.44 ± 1.27 09.32 ± 1.37 09.18 ± 1.27 * 0.001
2 h 08.22 ± 1.27 07.98 ± 1.28 * 0 7.88 ± 1.16 △ < 0.001
GDM A2[n(%)] 413(71.08) 711(77.11) * 675(82.72) < 0.001
*△
Insulin therapy[n(%)] 243(41.82) 440(47.72) * 403(49.39) * 0.016
Dexamethasone therapy[n(%)] 36(6.20) 73(7.92) 51(6.25) 0.291
Antihypertensive drugs therapy[n(%)] 21(3.61) 52(5.64) 57(6.99) * 0.026
Intrapartum hemorrhage volume(mL,x ± s) 0357.04 ± 140.92 0362.36 ± 131.92 0372.28 ± 144.37 0.107
Postpartum hemorrhage volume(mL,x ± s) 0483.16 ± 200.92 0492.02 ± 182.14 0504.68 ± 194.38 0.106
Neonatal weight(kg,x ± s) 03.28 ± 0.36 03.37 ± 0.39 * 03.41 ± 0.39 * < 0.001
Neonatal height(cm,x ± s) 49.97 ± 1.13 50.02 ± 1.15 50.11 ± 1.20 0.079
*
△
Compared with the group A,P < 0.05;compared with the group B,P < 0.05.
高而增加(P < 0.05),胎盘早剥和新生儿低血糖症的 变量的模型1中,孕前BMI与胰岛素使用率、降压药
发生率随孕前 BMI 的升高而降低(P < 0.05)。两两 物使用率、GDM A2 级、子痫前期、巨大儿发生率均
比较发现,C 组子痫前期(5.02% vs. 1.89%)、巨大儿 呈现显著正相关,与胎盘早剥、新生儿低血糖呈显
(7.35% vs. 3.10%)的发生率高于 A 组(P < 0.05),新 著负相关;在调整协变量后的模型2中,所有结局均
生儿高胆红素血症(5.15% vs. 2.82%)的发生率高于 与孕前BMI存在相关性。具体OR值及95%置信区间
B 组(P < 0.05)。其他妊娠结局两两比较差异无统 见表4。
计学意义(表2、3)。
3 讨 论
2.3 GDM孕产妇孕前BMI与不良妊娠结局的相关性
将上述比较中差异有统计学意义的妊娠结局 近年来,随着生活质量的提升以及饮食结构的
及药物使用纳入Logistic回归模型分析,在未调整协 改变,GDM 的发病率不断上升,其对母婴健康结局
表2 各组孕妇不良结局比较
Table 2 Comparison of adverse pregnancy outcomes among three groups [n(%)]
Variable Group A(n=581) Group B(n=922) Group C(n=816) P
Pre⁃eclampsia a 11(1.89) 31(3.36) 41(5.02) # 0.002
Premature 11(1.89) 12(1.30) 11(1.35) 0.439
Postpartum haemorrhage 36(6.20) 49(5.31) 42(5.15) 0.415
Chorioamnionitis 50(8.61) 76(8.24) 64(7.84) 0.605
Intrahepatic cholestasis of pregnancy 8(1.38) 12(1.30) 05(0.61) 0.148
Polyhydramnios 13(2.24) 27(2.93) 29(3.55) 0.153
Premature rupture of membranes 210(36.14) 313(33.95) 274(33.58) 0.341
Placenta previa 06(1.03) 06(0.65) 11(1.35) 0.467
b
Placental abruption 06(1.03) 06(0.65) 01(0.12) 0.022
Fetal distress 47(8.09) 69(7.48) 72(8.82) 0.557
#
Compared with the group A,P < 0.05. a:There is a positive linear trend relationship between pre⁃pregnancy BMI level of GDM pregnant women
and maternal adverse outcomes,i.e.,the higher the pre⁃pregnancy BMI of GDM pregnant women,the greater the risk of pre⁃eclampsia occurrence.
b:There is a negative linear trend relationship between pre⁃pregnancy BMI level of GDM pregnant women and maternal adverse outcomes,i.e.,the higher
the pre⁃pregnancy BMI of GDM pregnant women,the smaller the risk of placental abruption occurrence.