


Page 106 - 南京医科大学自然版
P. 106
第44卷第9期
               ·1278 ·                           南 京    医 科 大 学 学         报                        2024年9月


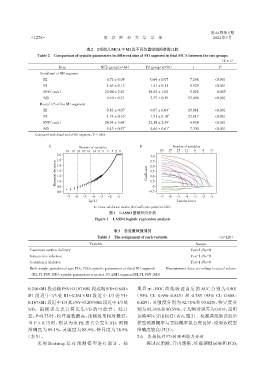
                                         表2 2组胎儿MCA中M1段不同位置收缩期参数比较
                  Table 2 Comparison of systolic parameters in different sites of M1 segment in fetal MCA between the two groups
                                                                                                       (x ± s)
                            Item                NFD group(n=64)     FD group(n=56)        t           P
                   Distal end of M1 segment
                                                           a                   a
                     RI                          00.72 ± 0.05         00.64 ± 0.07       7.268      <0.001
                     PI                          01.63 ± 0.13 a       01.41 ± 0.11 a     9.929      <0.001
                     PSV(cm/s)                   20.06 ± 2.67 a       18.82 ± 1.62 a     3.022       0.003
                     S/D                         04.10 ± 0.31 a       03.37 ± 0.19 a    13.400      <0.001
                   Mesial 1/3 of the M1 segment
                     RI                          00.83 ± 0.07 *       00.67 ± 0.04 *    15.081      <0.001
                                                           *                   *
                     PI                          01.74 ± 0.16         01.51 ± 0.10      23.817      <0.001
                     PSV(cm/s)                   24.94 ± 3.64 *       22.18 ± 2.39 *     4.834      <0.001
                     S/D                         05.43 ± 0.57 *       04.64 ± 0.61 *     7.330      <0.001
                                            *
                 Compared with distal end of M1 segment,P < 0.05.

                        A                                         B              Number of variables
                                      Number of variables
                               19 19 18 17 16 14 11 9 7 5 2 0              19  17  15  11  6  4   0
                           2.0
                                                                      3.0
                           1.8                                        2.5
                           Binomial deviation  1.4                   Coefficient  1.5
                           1.6
                                                                      2.0
                           1.2
                                                                      1.0
                           1.0
                           0.8                                        0.5 0
                           0.6                                       -0.5
                                -7  -6  -5  -4  -3  -2  -1                 -7  -6  -5  -4  -3  -2  -1
                                          Lg(λ)                                    Penalty factor
                                            A:Cross⁃validation results. B:Coefficient paths(n=120).
                                                   图1   LASSO逻辑回归分析
                                             Figure 1 LASSO logistic regression analysis


                                                      表3 各变量赋值情况
                                              Table 3 The assignment of each variable                (n=120)
                                          Variable                                         Assign
               Caesarean section delivery                                                Yes=1,No=0
               Intrauterine infection                                                    Yes=1,No=0
               Gestational diabetes                                                      Yes=1,No=0
               Birth weight,gestational age,PO2,PCO2,systolic parameters at distal M1 segment  Measurement data,according to actual values
               (RI,PI,PSV,S/D),systolic parameters at mesial 1/3 of M1 segment(RI,PI,PSV,S/D)


              0.246×M1段远端PSV+0.167×M1段远端S/D+0.648×              果显示,ROC 曲线验证前后的 AUC 分别为 0.801
              M1 段近中 1/3 处 RI+0.261×M1 段近中 1/3 处 PI+           (95% CI:0.696~0.845)和 0.785(95% CI:0.688~
              0.167×M1段近中1/3处PSV+0.209×M1段近中1/3处                0.829),灵敏度分别为 92.78%和 90.62%,特异度分
              S/D。根据该公式计算发生 FD 的可能性。经计                          别为82.31%和80.59%,平均绝对误差为0.019,说明
              算,P=0.75 时,约登指数最高,预测效果相对最好,                       该模型区分度较好(表6,图2)。校准曲线验证前后
              当 P > 0.75 时,则认为该 PE 患者会发生 FD,预测                  模型预测概率与实际概率拟合度良好,说明该模型

              准确度为 89.1%,灵敏度为 88.9%,特异度为 78.9%                  准确度较高(图3)。
             (表 5)。                                             2.6 各指标对FD的预测能力分析
                  采用 Bootstrap 法对预测模型进行验证。结                          探讨以胎龄、宫内感染、妊娠期糖尿病和 PCO2

