


Page 108 - 南京医科大学自然版
P. 108
第44卷第9期
               ·1280 ·                           南 京    医 科 大 学 学         报                        2024年9月


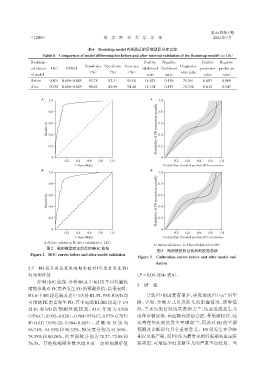
                                          表6 Bootstrap model内部验证前后模型区分度比较
                     Table 6 Comparison of model differentiation before and after internal validation of the Bootstrap model (n=120)

               Bootstrap                                            Positive  Negative        Positive  Negative
                                        Sensitivity Specificity Accuracy            Diagnostic
               validation  AUC  95%CI                              likelihood likelihood     predictive predictive
                                          (%)      (%)     (%)                      odds ratio
               of model                                              ratio   ratio             value    value
               Before   0.801 0.696-0.845  92.78   82.31    95.94   14.623   0.130   79.061    0.683    0.969
               After    0.785 0.688-0.829  90.62   80.59    94.48   14.194   0.139   72.336    0.634    0.947

                    A   1.0                                           A   1.0


                        0.8                                               0.8

                       Sensitivity  0.6                                  Probability of FD occurrence actually  0.6

                        0.4
                                                                          0.4

                        0.2                                               0.2

                         0                                                 0
                               0.2  0.4  0.6   0.8  1.0                          0.2   0.4  0.6  0.8  1.0
                                    1-Specificity                           Probability of model predicts FD occurrence
                    B                                                 B
                        1.0                                               1.0

                        0.8                                               0.8

                       Sensitivity  0.6                                  Probability of FD occurrence actually  0.6

                        0.4
                                                                          0.4
                        0.2                                               0.2


                         0                                                 0
                               0.2  0.4  0.6   0.8  1.0                          0.2   0.4  0.6  0.8  1.0
                                    1-Specificity                           Probability of model predicts FD occurrence
                     A:Before validation. B:After validation(n=120).
                                                                        A:Before validation. B:After validation(n=120).
                       图2 预测模型验证前后的ROC曲线                                 图3   预测模型验证前后的校准曲线
               Figure 2 ROC curves before and after model validation  Figure 3  Calibration curves before and after model vali⁃
                                                                         dation
              2.7  M1 段不同位置收缩期参数对 PE 患者发生 FD
              的预测价值                                            (P < 0.05,图4,表8)。
                  绘制 ROC 曲线,分析 MCA 中 M1 段不同位置收
                                                                3  讨 论
              缩期参数对PE患者发生FD的预测价值,结果表明,
              MCA中M1段远端及近中1/3处RI、PI、PSV和S/D均                         导致 FD 的因素有很多,研究发现 FD 与产妇年

              可预测PE患者发生FD,其中远端RI、M1段近中1/3                       龄、孕周、分娩方式以及胎儿的胎盘情况、脐带情
              处 RI 和 S/D 的预测性能较高,AUC 分别为 0.926                  况、羊水污染情况均显著相关              [10] ,还会造成新生儿
             (95%CI:0.992~0.826)、0.904(95%CI:0.979~0.785)       成年后糖尿病、高血糖高渗综合征、骨质疏松症、痛
              和 0.917(95% CI:0.984~0.807),灵 敏 度 分 别 为           风等慢性疾病的发生率增高              [11] ,因此对 FD 的早期
              96.71%、94.53%和 96.32%,特异度分别为 81.56%、              预测及诊断研究具有重要意义。FD 常发生在孕晚
              78.35%和 80.26%,约登指数分别为 78.27、72.88 和              期以及临产期,而PE作为最常见的妊娠期高血压疾
              76.58。其他收缩期参数也均具有一定的预测价值                          病类型,可增加孕妇及新生儿的严重不良结局。当

