


Page 107 - 南京医科大学自然版
P. 107
第44卷第9期 王云灿,黄乃磊,刘文聪,等. 高清晰度血流成像检测胎儿大脑中动脉M1段不同位置收缩期参数对子痫
                  2024年9月       前期胎儿窘迫的预测价值[J]. 南京医科大学学报(自然科学版),2024,44(9):1274-1282,1322·1279               ·


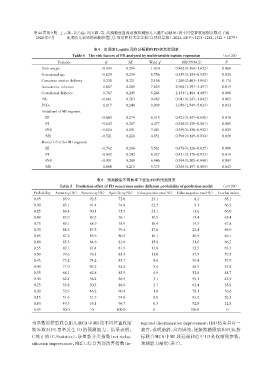
                                            表4 多因素Logistic回归分析影响FD的危险因素
                                  Table 4 The risk factors of FD analyzed by multivariable logistic regression  (n=120)

                            Variable              β         SE        Wald χ 2       OR(95%CI)           P
                    Birth weight                -0.149     0.294       1.010      0.862(0.384-1.652)    0.068
                    Gestational age             -1.024     0.234       8.756      0.359(0.154-0.925)    0.021
                    Caesarean section delivery   0.238     0.221       2.156      1.269(0.463-1.994)    0.174
                    Intrauterine infection       1.087     0.285       7.625      2.964(1.397-3.497)    0.019
                    Gestational diabetes         0.767     0.245       6.264      2.154(1.484-4.485)    0.008
                                                -0.061     0.263       0.462      0.941(0.247-1.642)    0.083
                    PO2
                                                 1.117     0.248       9.009      3.056(1.549-5.023)    0.032
                    PCO2
                    Distal end of M1 segment
                      RI                        -0.865     0.274       6.315      0.421(0.147-0.836)    0.018
                      PI                        -0.642     0.287       4.477      0.526(0.129-0.861)    0.009
                      PSV                       -1.024     0.291       7.041      0.359(0.136-0.922)    0.025
                      S/D                       -0.521     0.224       4.651      0.594(0.149-0.834)    0.036
                    Mesial 1/3 of the M1 segment
                      RI                        -0.742     0.266       5.581      0.476(0.126-0.825)    0.006
                      PI                        -0.842     0.243       6.927      0.431(0.178-0.923)    0.014
                      PSV                       -0.931     0.289       6.446      0.394(0.205-0.948)    0.009
                      S/D                       -1.008     0.215       9.375      0.365(0.197-0.865)    0.043

                                              表5 预测模型不同概率下发生FD的预测效果
                             Table 5 Prediction effect of FD occurrence under different probability of prediction model  (n=120)
                 Probability  Accuracy(%) Sensitivity(%) Specificity(%) False positive rate(%)  False negative rate(%) Youden index
                 0.95         83.9        92.5         072.6           23.1              008.2           65.1
                 0.90         85.1        91.4         074.8           22.5              009.1           66.2
                 0.85         86.4        90.1         075.9           21.1              011.6           66.0
                 0.80         87.9        89.3         076.1           19.5              015.4           65.4
                 0.75         89.1        88.9         078.9           18.4              019.3           67.8
                 0.70         88.3        87.5         079.4           17.6              023.4           66.9
                 0.65         87.2        85.6         080.5           16.1              026.9           66.1
                 0.60         85.3        84.6         081.6           15.8              031.6           66.2
                 0.55         82.1        81.4         081.9           13.8              032.5           63.3
                 0.50         79.6        76.1         083.4           11.0              037.9           59.5
                 0.45         75.2        74.2         083.7           08.6              039.4           57.9
                 0.40         71.0        69.2         084.6           05.4              046.5           53.8
                 0.35         68.1        62.8         085.9           04.9              052.8           48.7
                 0.30         62.4        56.4         086.5           03.1              059.1           42.9
                 0.25         53.8        50.2         088.6           02.7              063.4           38.8
                 0.20         52.9        46.2         090.4           01.6              078.1           36.6
                 0.15         51.6        31.7         094.6           00.8              083.2           26.3
                 0.10         49.3        16.1         096.7           00.3              092.8           12.8
                 0.05         50.0        00.0         100.0           00.0              100.0           00.0

                为参数的模型联合胎儿MCA中M1段不同位置收缩                           tegrated discrimination improvement,IDI)结果具有一
                期参数对 PE 患者发生 FD 的预测能力。结果表明,                       致性,说明胎龄、宫内感染、妊娠期糖尿病和PCO2指

                C 统计值(C⁃Statistics)、净重新分类指数(net reclas⁃           标联合MCA中M1段远端和近中1/3处收缩期参数,
                sification improvement,NRI)、综合判别改善指数(in⁃          预测能力最优(表7)。

