
Page 12 - 南京医科大学自然版
P. 12
第45卷第11期
·1542 · 南 京 医 科 大 学 学 报 2025年11月
A B C
Cellular response to hypoxia p21
-lg(P) cor=0.262 expression 10
Positive regulation of angiogenesis (log2 TPM) 3 P<0.001 8
Response to hypoxia 5.0 6
4.5 2
Negative regulation of cell proliferation RBMS3 4
4.0 R =0.407
2
Activation of MAPK activity 3.5 1 Relative p21 2 P < 0.000 1
Extracellular matrix organization count Expression level 0 0
5 4 6 8 10 12 14
Positive regulation of cell migration
10 2 4 6 8 10 Relative RBMS3 expression
Cell⁃cell signaling 15 Expression level(log2 TPM)
Positive regulation of cation channel activity 20
25
Cell adhesion
2.5 3.0 3.5 4.0
mRNA expression 2.0 *** * mRNA expression 1.5 Sh2 *** RBMS3 21 kDa (/β⁃actin) 1.5 *** *
D NC E SCR F SUM⁃1315 MDA⁃MB⁃231 G SUM⁃1315⁃NC
Sh1
SUM⁃1315⁃RBMS3
NC RBMS3
NC RBMS3
RBMS3
***
p21
*
1.5
*
1.0
48 kDa
1.0
1.0
Relative p21 0.5 0 MDA⁃MB⁃231 Relative p21 0.5 0 SUM⁃1315 MDA⁃MB⁃231 β⁃actin 42 kDa Protein level 0.5 0 p21 RBMS3
SUM⁃1315
H I J
SUM⁃1315
MDA⁃MB⁃231⁃NC SCR Sh1 Sh2 SCR Sh1 Sh2 (/β⁃actin) 1.5 * * ** SUM⁃1315⁃SCR
MDA⁃MB⁃231
***
MDA⁃MB⁃231⁃RBMS3
(/β⁃actin) 2.0 ** ** RBMS3 21 kDa 1.0 SUM⁃1315⁃Sh2
SUM⁃1315⁃Sh1
p21
1.5
0.5
48 kDa
Protein level 1.0 0 β⁃actin 42 kDa Protein level 0 p21 RBMS3
0.5
K p21 RBMS3 L RBMS3 p21 Ki67
MDA⁃MB⁃231⁃SCR
MDA⁃MB⁃231⁃Sh1
MDA⁃MB⁃231⁃Sh2 SUM⁃1315⁃NC
(/β⁃actin) 1.5 * **
**
**
1.0
Protein level 0.5 0 p21 RBMS3 SUM⁃1315⁃RBMS3
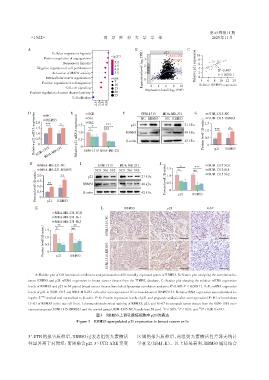
A:Bubble plot of GO functional enrichment analysis based on differentially expressed genes of RBMS3. B:Scatter plot analyzing the correlation be⁃
tween RBMS3 and p21 mRNA expression in breast cancer tissues from the TIMER database. C:Scatter plot showing the relative mRNA expression
2
levels of RBMS3 and p21 in 34 paired breast cancer tissues(two⁃tailed Spearman correlation analysis,R =0.407,P < 0.000 1). D,E:mRNA expression
levels of p21 in SUM⁃1315 and MDA⁃MB⁃231 cells after overexpression(D)or knockdown of RBMS3(E). Relative RNA expression was calculated us⁃
ing the 2 -ΔΔCt method and normalized to β⁃actin. F-K:Protein expression levels of p21 and grayscale analysis after overexpression(F-H)or knockdown
(I-K)of RBMS3 in the two cell lines. L:Immunohistochemical staining of RBMS3,p21,and Ki⁃67 in xenograft tumor tissues from the SUM⁃1315 over⁃
* ** ***
expression group(SUM⁃1315⁃RBMS3)and the control group(SUM⁃1315⁃NC)(scale bar:50 μm). P < 0.05,P < 0.01,and P < 0.001(n=3).
图3 RBMS3上调乳腺癌细胞中p21的表达
Figure 3 RBMS3 upregulated p21 expression in breast cancer cells
3′⁃UTR的报告质粒后,RBMS3过表达组荧光素酶活 区域的报告质粒后,两组荧光素酶活性差异无统计
性显著高于对照组;而转染含p21 3′⁃UTR ARE突变 学意义(图4J、K)。以上结果表明,RBMS3通过结合