


Page 38 - 南京医科大学自然版
P. 38
第45卷第5期
               ·624 ·                            南 京    医 科 大 学 学         报                        2025年5月


                 A                                       B
                                                                                     Top 10 of pathway enrichment
                     240                                                                           Q value
                                                 Up
                     220                                                                             0
                                                 No⁃DEG                         Lysosome
                     200                                                                             0.000 2
                     180                         Down        Kaposi sarcoma⁃associated herpes virus
                                                                                                     0.000 4
                     160
                     value)  140                                                 Measles             0.000 6
                                                                     Epstein⁃Barr virus infection
                     120
                                                                                                     0.000 8
                     (Q  lg  100                                               Ferroptosis           0.001
                      80
                      60                                                       Influenza A
                                                                                                   Gene number
                      40                                       NOD⁃like receptor signaling pathway
                                                                                                    9
                      20
                                                                    Chemokine signaling pathway     14
                       0
                                                                               Phagosome            18
                     -20
                        -6 -5 -4 -3 -2 -1 0 1 2 3 4 5 6                        Hepatitis C          23
                                log2 (IGT/MMT)                                                      27
                                                                                        0 0.05 0.10 0.15 0.20
                 C                                  D
                           MMT     MMT+IGT             0.6    *                         Rich ratio
                                                       TFR/GAPDH
                     TFR                    80 kDa     0.4
                   GAPDH                    37 kDa     0.2
                                                         0
                                                           MMT MMT+IGT
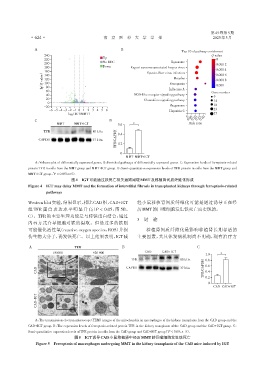
                 A:Volcano plot of differentially expressed genes. B:Enriched pathways of differentially expressed genes. C:Expression levels of ferroptosis⁃related
              protein TFR in cells from the MMT group and MMT+IGT group. D:Semi⁃quantitative expression levels of TFR protein in cells from the MMT group and
                          *
              MMT+IGT group,P < 0.05(n=5).
                                  图4 IGT可能通过铁死亡相关通路减缓MMT及移植肾间质纤维化形成
              Figure 4  IGT may delay MMT and the formation of interstitial fibrosis in transplanted kidneys through ferroptosis⁃related
                      pathways

              Western blot实验,结果显示,相比CAD组,CAD+IGT                轻小鼠移植肾间质纤维化可能是通过诱导正在经
              组 TFR 蛋白表达水平明显升高(P < 0.05,图 5B、                   历MMT的巨噬细胞发生铁死亡而实现的。
              C)。TFR的主要生理功能是与转铁蛋白结合,通过
                                                                3  讨 论
              内吞方式介导细胞对铁的摄取。但是过多的铁则
              可能催化活性氧(reactive oxygen species,ROS)并损                 移植肾间质纤维化是影响移植肾长期存活的
              伤生物大分子,诱发铁死亡。以上结果表明,IGT减                          主要因素,其具体发病机制尚不明确,现有治疗方

               A                    TEM                  B                                  C
                          ×8 000            ×20 000                 CAD     CAD+IGT                    *
                                                                                                1.0
                                                              TFR                   80 kDa      0.8
                                                                                               TFR/GAPDH  0.6
                  CAD                                                                           0.4
                                                                                    37 kDa
                                                           GAPDH
                                                                                                0.2
                                                                                                 0
                                                                                                    CAD CAD+IGT

                  CAD+IGT


                 A:The transmission electron microscope(TEM)images of the mitochondria in macrophages of the kidney transplants from the CAD group and the
              CAD+IGT group. B:The expression levels of ferroptosis⁃related protein TFR in the kidney transplants of the CAD group and the CAD+IGT group. C:
                                                                              *
              Semi⁃quantitative expression levels of TFR protein in cells from the CAD group and CAD+IGT group( P < 0.05,n=5).
                                   图5 IGT诱导CAD小鼠移植肾中经历MMT的巨噬细胞发生铁死亡
                  Figure 5  Ferroptosis of macrophages undergoing MMT in the kidney transplants of the CAD mice induced by IGT

