
Page 124 - 《南京医科大学学报》2026年第1期
P. 124
第46卷第1期
· 118 · 南 京 医 科 大 学 学 报 2026年1月
METTL18、SERPINC1、ZNF496、AC016683.6、PAX8、 中 rs34788973、rs61742093、rs13195509 的 CADD≥
GLS、LARS2、NCKIPSD、QRICH1、AMT,图3E)。最显 12.37,距离 rs34788973、rs61742093 最近的基因为
著的易感基因是SPATS2L(图3F)。作用于食管全层 OR2B2;距 离 rs13195509 最 近 的 基 因 是 BTN2A1
的易感基因及最显著的易感基因,都值得进一步探索。 (表 3)。可见抑郁与 GERD、NERD 都与 BTN2A1 免
[13]
2.7 抑郁与GERD、NERD共享基因的功能注释 疫调节有关,与他人研究一致 。
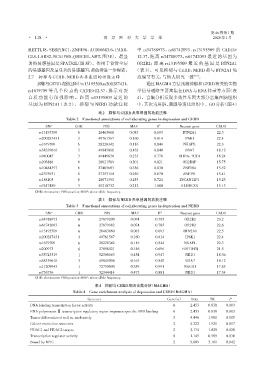
抑郁与GERD功能注释中rs13195509、rs200287431、 通过MAGMA方法预测抑郁和GERD有关的生物
rs1679709 等几个位点的 CADD≥12.37,提示对蛋 学信号通路主要富集在DNA与RNA转录等方面(表
白质功能有很强影响。距离 rs13195509 最近的 4)。富集分析发现多效性基因大部分富集在脑组织
基因为 BTN2A1(表 2)。抑郁与 NERD 功能注释 中,其次为肝脏、胰腺等消化组织中。GO分析(图 4)
表2 抑郁与GERD共享基因的功能注释
Table 2 Functional annotations of collaborating genes in depression and GERD
2
SNP CHR POS MAF R Nearest gene CADD
rs13195509 6 26463660 0.083 0.693 BTN2A1 22.50
rs200287431 3 49761567 0.160 0.814 IP6K1 22.40
rs1679709 6 28228342 0.116 0.844 NKAPL 22.30
rs58339610 3 49845006 0.163 0.840 UBA7 18.12
rs940045 3 49449638 0.233 0.776 RHOA:TCTA 16.24
rs203888 6 28021589 0.201 0.821 OR2B8P 15.75
rs10484397 6 27405683 0.356 0.830 ZNF184 15.52
rs2393931 6 27353114 0.256 0.670 ZNF391 15.41
rs188105 6 28071393 0.253 0.724 ZSCAN12P1 15.23
rs7617480 3 49210732 0.212 1.000 KLHDC8B 15.13
CHR:chromsome;POS:position;MAF:minor allele frequency.
表3 抑郁与NERD共享基因的功能注释
Table 3 Functional annotations of collaborating genes in depression and NERD
2
SNP CHR POS MAF R Nearest gene CADD
rs34788973 6 27879200 0.074 0.785 OR2B2 23.20
rs61742093 6 27879982 0.074 0.785 OR2B2 22.60
rs13195509 6 26463660 0.083 0.693 BTN2A1 22.50
rs200287431 3 49761567 0.160 0.814 IP6K1 22.40
rs1679709 6 28228342 0.116 0.844 NKAPL 22.30
rs200973 6 27858421 0.146 0.696 HIST1H3J 21.50
rs35723519 1 52306063 0.454 0.947 NRD1 18.36
rs58339610 3 49845006 0.163 0.840 UBA7 18.12
rs11209943 1 72750500 0.359 0.991 NEGR1 17.85
rs736756 1 52344414 0.473 0.881 NRD1 17.34
CHR:chromsome;POS:position;MAF:minor allele frequency.
表4 抑郁与GERD基因富集分析(MAGMA)
Table 4 Gene enrichment analysis of depression and GERD(MAGMA)
Gene set Gene(n) Beta SE P
DNA binding transcription factor activity 6 2.453 0.838 0.003
RNA polymerase Ⅱ transcription regulatory region sequence specific DNA binding 6 2.453 0.838 0.003
Tumor differentiated well vs. moderately 3 4.446 1.981 0.015
Calorie restriction neocortex 2 4.222 1.921 0.017
HDAC1 and HDAC2 targets 2 2.174 1.025 0.020
Transcription regulator activity 8 1.145 0.589 0.030
Bound by MYC 2 5.609 3.161 0.042