
Page 92 - 《南京医科大学学报》2026年第1期
P. 92
第46卷第1期
· 86 · 南 京 医 科 大 学 学 报 2026年1月
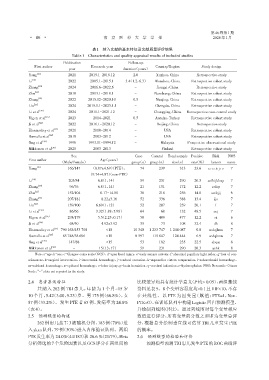
表1 纳入文献的基本特征及文献质量评价结果
Table 1 Characteristics and quality appraisal results of included studies
Publication Follow⁃up
First author Research year Country/Region Study design
year duration(years)
Yang [18] 2021 2015.1-2018.12 2.0 Xuzhou,China Retrospective study
Li [19] 2022 2005.1-2015.1 3.4(1.2,6.3) Wenzhou,China Retrospective cohort study
Zhang [20] 2024 2016.6-2022.6 - Jiangxi,China Retrospective study
[21]
Zhu 2018 2013.1-2018.1 - Nanchang,China Retrospective cohort study
[22]
Zhang 2022 2015.12-2020.10 0.5 Nanjing,China Retrospective cohort study
[23]
Liu 2024 2015.1.1-2023.1.1 - Chengdu,China Retrospective cohort study
Li et al [24] 2024 2011.1-2021.12 - Chongqing,China Retrospective case⁃control study
Ulgen et al [25] 2023 2014-2021 0.5 Antalya,Turkey Retrospective cohort study
Ji et al [26] 2022 2016.1-2020.12 - Beijing,China Retrospective study
[27]
Elsamadicy et al 2021 2010-2014 - USA Retrospective cohort study
[28]
Rumalla et al 2018 2003-2012 - USA Retrospective cohort study
[29]
Ong et al 1996 1993.11-1994.12 - Malaysia Prospective observational study
Mikkonen et al [30] 2020 2003-2013 - Finland Retrospective cohort study
Sex Case Control Total sample Positive Risk NOS
First author Age(years)
(Male/Female) group(n) group(n) size(n) rate(%) factors score
Yang [18] 166/147 (8.87±4.69)(PTE); 00 074 0 000 239 0 000 313 23.6 c,e,i,j,o 7
(9.74±4.87)(non⁃PTE)
[19]
Li 203/84 06.8(1,14)0000 00 059 0 000 231 0 000 290 20.3 acfhijklmp 7
[20]
Zhang 96/76 06.8(1,14)0000 00 021 0 000 151 0 000 172 12.2 cdiqr 7
[21]
Zhu 152/104 0.17-14.00 00 038 0 000 218 0 000 256 14.8 acdqij 6
Zhang [22] 207/181 8.22±3.16 00 052 0 000 336 0 000 388 13.4 ijo 7
Liu [23] 159/100 06.69(1,12)00000 00 052 0 000 207 0 000 259 20.1 l 7
Li et al [24] 86/66 3.32(1.88,5.98) 00 064 0 000 068 0 000 132 48.5 cej 7
[25]
Ulgen et al 298/179 05.5(2.25,0.17) 00 058 0 000 409 0 000 477 12.2 ei 6
[26]
Ji et al 68/40 4.92±3.92 00 035 0 000 073 0 000 108 32.4 dh 8
[27]
Elsamadicy et al 790 163/453 708 <18 10 340 1 233 747 1 244 087 00.8 acdqjlmn 7
Rumalla et al [28] 85 748/38 696 <18 08 597 0 115 847 0 124 444 06.9 acdqhmn 7
Ong et al [29] 147/88 <15 00 053 0 000 182 0 000 235 22.5 abqm 6
Mikkonen et al [30] - 015(13,17)00 00 059 0 000 231 0 000 290 20.3 achk 8
Note:a=age,b=sex,c=Glasgow coma scale(GCS),d=open head injury,e=early seizure activity,f=abnormal pupillary light reflex,g=loss of con⁃
sciousness,h=surgical intervention,i=intracranial hemorrhage,j=cerebral contusion,k=suprasellar cistern compression,l=subarachnoid hemorrhage,
m=subdural hemorrhage,n=epidural hemorrhage,o=lobar injury,p=brain herniation,q=cerebral infarction,r=hydrocephalus. NOS:Newcastle⁃Ottawa
Scale;“-”:data not reported in the study.
2.4 患者基线特征 比较差异均具有统计学意义(P均> 0.05),两组基线
共纳入 262 例 TBI 患儿,年龄为 1 个月~15 岁 资料见表5。8个变量容忍度均>0.1且VIF<10,不存
10 个月,5.42(3.00,9.23)岁。男 175 例(66.8%),女 在共线性。以 PTE 为因变量(赋值:PTE=1,Non⁃
87 例(33.2%)。发生 PTE 者 65 例,发病率为 24.8% PTE=0),在训练队列中构建Logistic回归预测模型,
(表4)。 并绘制列线图(图2)。通过列线图对每个变量相应
2.5 预测模型的构建 数值进行评分,所有变量的分数之和即为变量总评
262 例患儿按 7∶3 被随机分组,183 例(70%)进 分,根据总分绘制垂直线可估算 TBI 儿童发生 PTE
入ykxa队列,79例(30%)进入内部验证队列。两组 的概率。
PTE发生率为 24.0%(44/183)和 26.6 %(21/79),Meta 2.6 预测模型的检验和评价
分析筛选的7个危险因素以及GCS评分在两组间的 预测模型预测TBI患儿发生PTE的ROC曲线评