Page 96 - 《南京医科大学学报》2026年第1期
P. 96

第46卷第1期
              · 90   ·                           南 京    医 科 大 学 学         报                        2026年1月


              自 Meta 分析筛选结果。在模型构建变量筛选方法                         究显示轻型 TBI 的癫痫发生率是普通人群的 2 倍,
              上,本研究创新性地采用Meta分析结合临床因素的                          而重型 TBI 则高达 7 倍      [32] 。TBI 的严重程度可通过
              筛选标准,来确定纳入 Logistic 回归模型的变量,而                     GCS来衡量。国内学者通过回顾性分析发现GCS评
              非传统的逐步回归、LASSO、弹性网络等经典方法。                         分(OR=29.081,95%CI:3.125~270.614,P=0.003)和
                  PTE 发生风险与损伤严重程度密切相关,前述                        血清乳酸是儿童重型颅脑损伤预后的独立危险因
              Meta 分析证实,儿童严重 TBI 显著增加 PTE 风险                    素 。虽然在本研究GCS评分的合并效应量没有统
                                                                  [33]
             (OR=1.81,95% CI =1.23~2.67,P <0.001) ,另有研          计学意义(OR=1.466,95%CI:0.977~2.199,P=0.065),
                                                  [31]
                       A                                            B
                            1.0                                        1.0
                                          0.162(0.612,0.932)
                            0.8                                        0.8
                                                                                0.283(0.845,0.714)
                           Sensitivity  0.4                            Sensitivity  0.4
                            0.6
                                                                       0.6

                                            AUC:0.800                                   AUC:0.830
                            0.2                                        0.2


                             0                                           0
                               1.0  0.8  0.6  0.4  0.2  0                 1.0  0.8  0.6  0.4  0.2   0
                                         Specificity                                Specificity
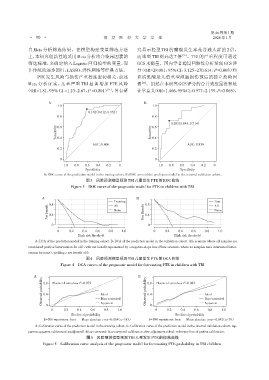
                     A:ROC curve of the prediction model in the traning cohort. B:ROC curve of the prediction model in the internal validation cohort.
                                         图3 风险预测模型预测TBI儿童发生PTE的ROC曲线
                                  Figure 3 ROC curve of the prognostic model for PTE in children with TBI


                    A                                           B
                                                      Training      0.8                             Test
                        0.8
                       Net benefit  0.4               None         Net Benefit  0.4                 None
                                                                                                    All
                                                      All
                         0                                           0
                           .0    0.2   0.4   0.6   0.8   1.0            .0   0.2   0.4   0.6    0.8   1.0
                                     High risk threshold                         High risk threshold
                 A:DCA of the prediction model in the training cohort. B:DCA of the prediction model in the validation cohort. All:scenario where all samples are
              considered positive(intervention for all),with net benefit represented by a negative⁃slope line;None:scenario where no samples were intervened(inter⁃
              vention for none),yielding a net benefit of 0.
                                         图4 风险预测模型预测TBI儿童发生PTE的DCA曲线
                             Figure 4 DCA curves of the prognostic model for forecasting PTE in children with TBI

                 A   0.8  Hosmer⁃Lemeshow P=0.079                B   0.8  Hosmer⁃Lemeshow P=0.082
                    Observed probability  0.4   Ideal               Observed probability  0.4  Ideal


                                                                                               Bias⁃corrected
                                                Bias⁃corrected
                      0
                                                                                                 0.8
                         0     0.2   0.4   0.6  Apparent  1.0         0  0    0.2   0.4    0.6  Apparent  1.0
                                                 0.8
                                  Predicted probability                           Predicted probability
                     B=500 repetitions,boot  Mean absolute error=0.054(n=183)  B=500 repetitions,boot  Mean absolute error=0.042(n=79)
                 A:Calibration curve of the prediction model in the training cohort. B:Calibration curve of the prediction model in the internal validation cohort. Ap⁃
              parent:apparent calibration(unadjusted);Bias⁃corrected:bias⁃corrected calibration after adjustment;Ideal:reference line of perfect calibration.
                                         图5   风险预测模型预测TBI儿童发生PTE的校准曲线
                     Figure 5  Calibration curve analysis of the prognostic model for forecasting PTE probability in TBI children
   91   92   93   94   95   96   97   98   99   100   101