
Page 93 - 《南京医科大学学报》2026年第1期
P. 93
第46卷第1期 张慧文,祁红玉,张 华,等. 儿童创伤后癫痫风险预测模型构建与验证:基于队列研究的
2026年1月 Meta分析[J]. 南京医科大学学报(自然科学版),2026,46(1):82-93 · 87 ·
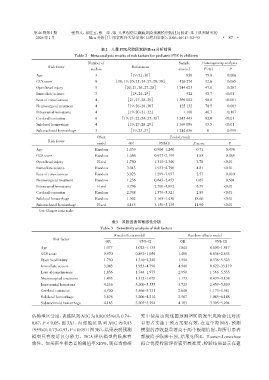
表2 儿童PTE风险因素的Meta分析结果
Table 2 Meta⁃analysis results of risk factors for pediatric PTE in children
Number of Sample Heterogeneity analysis
Risk factor References
2
studies size(n) I(%) P
Age 3 [19,21,30] 836 75.8 0.006
GCS score 8 [18,19,20,21,24,27,28,30] 126 274 92.6 0.065
Open head injury 5 [20,21,26,27,28] 1 244 623 47.8 0.287
Immediate seisure 3 [18,24,25] 922 93.7 <0.010
Loss of consciusness 4 [21,27,28,29] 1 369 022 98.8 <0.001
Neurosurgical treatment 4 [19,26,28,30] 125 132 78.5 0.003
Intracranial hematoma 4 [19,20,21,22] 1 100 40.7 0.167
Cerebral contusion 6 [19,21,22,24,27,30] 1 245 443 82.0 <0.010
Subdural hemorrhage 4 [19,27,28,29] 1 369 056 95.5 <0.010
Subarachnoid hemorrhage 3 [19,23,27] 1 244 636 0. 0.999
Effect Pooled result
Risk factor
model OR 95%CI Z score P
Age Random 1.059 0.904-1.240 00.71 <0.476
GCS score Random 1.466 0.977-2.199 01.85 <0.065
Open head injury Fixed 1.750 1.310-2.340 03.78 <0.010
Immediate seisure Random 3.043 1.933-4.790 04.81 <0.010
Loss of consciusness Random 3.023 1.299-7.037 02.57 <0.010
Neurosurgical treatment Random 1.256 0.643-2.453 00.67 <0.504
Intracranial hematoma Fixed 3.796 2.700-4.892 06.79 <0.010
Cerebral contusion Random 2.708 1.379-5.321 02.89 <0.010
Subdural hemorrhage Random 1.302 1.165-1.438 18.66 <0.010
Subarachnoid hemorrhage Fixed 4.143 3.150-5.135 11.90 <0.010
Gcs:Glasgow coma scale.
表3 风险因素的敏感性分析
Table 3 Sensitivity analysis of risk factors
Fixed⁃effects model Random⁃effects model
Risk factor
OR 95% CI OR 95% CI
Age 1.077 1.022-1.135 1.044 0.600-1.817
GCS score 0.970 0.892-1.056 1.486 0.836-2.633
Open head injury 1.750 1.310-2.340 1.554 0.536-5.523
Immediate seisure 3.043 1.933-4.790 4.540 0.622-33.119
Loss of consciusness 1.856 1.744-1.975 2.950 1.566-5.555
Neurosurgical treatment 1.493 1.312-1.670 1.173 0.439-3.138
Intracranial hematoma 4.216 3.200-5.555 3.723 2.459-5.639
Cerebral contusion 4.320 3.566-5.231 2.648 1.173-5.981
Subdural hemorrhage 3.676 3.206-4.214 2.587 1.089-6.148
Subarachnoid hemorrhage 4.183 3.305-5.294 4.183 3.305-5.294
估模型区分度,训练队列AUC为0.80(95%CI:0.74~ 究中使用该列线图预测 PTE 的发生风险会比对所
0.87,P < 0.05,图 3A),内部验证队列 AUC 为 0.83 有患者实施干预方案更有效,在这个范围内,预测
(95%CI:0.73~0.93,P < 0.05)(图3B),结果表明预测 模型的净收益显著高于两个极端情况,即所有患者
模型具有良好区分能力。DCA 评估模型的临床有 都被给予临床干预,结果见图4。Hosmer⁃Lemeshow
效性。如果医生和患者的阈值率>20%,则在当前研 拟合优度检验评价模型校准度,检验结果显示在建