


Page 13 - 南京医科大学自然版
P. 13
第46卷第10期             王新新,黄伯贤,陆嘉逢. PUS7通过mRNA假尿嘧啶化调控胚胎发育过程中神经
                 2026年10月             谱系分化平衡[J]. 南京医科大学学报(自然科学版),2026,46(10):1437-1449                 ·1443 ·


                   A                                                   B
                                WT                  Pus7⁃KO                  1.5                       WT
                                                                                                       Pus7⁃KO
                                                                                 *
                                                                            mRNA level  1.0
                                                                             0.5
                                                             500 μm
                                                                              0
                                                                                Sox2  Oct4  Nanog  Klf4

                C          WT    Pus7⁃KO                   WT    Pus7⁃KO        D          WT
                                                                                           Pus7⁃KO
                   NANOG                  37 kDa    KLF4                60 kDa
                                                                                       1.5       *
                                                                                      Protein level
                   Tubulin                55 kDa  GAPDH                 36 kDa         1.0
                            WT    Pus7⁃KO                   WT   Pus7⁃KO               0.5
                     SOX2                 37 kDa    OCT4                 37 kDa
                                                                                        0
                                                                                          SOX2  OCT4 NANOG KLF4
                   Tubulin                55 kDa   Tubulin               55 kDa

                   E                        F
                       1.4                              WT⁃Rep1                WT⁃Rep2               WT⁃Rep3
                            WT
                      nm)  1.2  Pus7⁃KO  ***   1 000                 1 000                 1 000
                                                800
                                                                      800
                                                                                            800
                      (450  1.0  *            Count  600              600                   600
                      D
                       0.8
                                                400                   400                   400
                       0.6                      200                   200                   200
                           6 h  24 h  48 h
                                                  0                     0                     0
                                                    0  3  3  3  3  3      0  3  3  3  3  3      0  3  3  3  3  3
                   G        WT                      50×10 100×10 150×10 200×10 250×10  50×10 100×10 150×10 200×10 250×10  50×10 100×10 150×10 200×10 250×10
                      (%)  50  ***  **                  KO⁃Rep1                KO⁃Rep2               KO⁃Rep3
                            Pus7⁃KO
                      Cell cycle distribution  30  Count  1 000      1 000                 1 000
                       40
                                                800
                                                                                            800
                                                                      800
                       20
                                                                      600
                                                                                            600
                                                600
                       10
                                                400
                        0
                                 S
                                     G2/M
                           G1
                                                                                            200
                                                200                   400                   400
                                                                      200
                                                  0                     0                     0
                                                    0  3  3  3  3  3      0  3  3  3  3  3      0  3  3  3  3  3
                                                    50×10 100×10 150×10 200×10 250×10  50×10 100×10 150×10 200×10 250×10  50×10 100×10 150×10 200×10 250×10
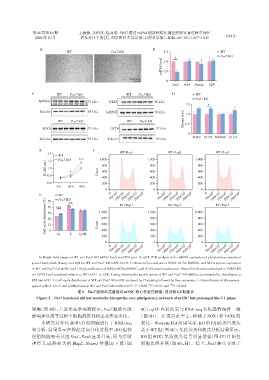
                   A:Bright⁃field images of WT and Pus7⁃KO mESC(Scale bar=500 μm). B:qRT⁃PCR analysis of the mRNA expression of pluripotency⁃associated
                genes(Sox2,Oct4,Nanog,and Klf4)in WT and Pus7⁃KO mESC(n=3). C:Western blot analysis of SOX2,OCT4,NANOG,and KLF4 protein expression
                in WT and Pus7⁃KO mESC(n=3). D:Quantification of SOX2,OCT4,NANOG,and KLF4 protein expression. Protein levels were normalized to TUBULIN
                or GAPDH and expressed relative to WT(n=3). E:CCK⁃8 assay showing the growth curves of WT and Pus7⁃KO mESCs,as measured by absorbance at
                450 nm(n=3). F:Cell⁃cycle distribution of WT and Pus7⁃KO mESC analyzed by PI staining followed by flow cytometry. G:Quantification of the percent⁃
                                                                      **
                                                               *
                ages of cells in G1,S,and G2/M phases in WT and Pus7⁃KO mESC(n=3). P < 0.05,P < 0.01,and  *** P < 0.001.
                                     图2 Pus7敲除未显著破坏mESC核心多能性网络,但导致G1期延长
                  Figure 2  Pus7 knockout did not markedly disrupt the core pluripotency network of mESC but prolonged the G1 phase
                聚集(图 4B),上述形态学观察提示,Pus7 敲除可能                      4C),qRT⁃PCR 结果与 RNA⁃seq 变化趋势保持一致
                影响神经诱导过程中细胞的排列状态及形态变化。                           (图 4D)。在蛋白水平上,检测了 SOX1 和 PAX6 的
                    本研究对分化 d0 和 d3 的细胞进行了 RNA⁃seq                 表达。Western blot结果显示,KO组PAX6蛋白表达
                和分析,结果显示在神经定向分化过程中,KO 组神                          高于WT组(图4E);免疫荧光和流式分析结果显示,
                经祖细胞相关基因 Sox1、Pax6 显著升高,而与后续                      KO 组 SOX1 免疫荧光信号明显增强(图 4F)且阳性
                神经元成熟相关的 Map2、Ncam1 等基因下降(图                       细胞比例升高(图 4G、H)。综上,Pus7 缺失导致了

