


Page 14 - 南京医科大学自然版
P. 14
第46卷第10期
               ·1444 ·                           南 京    医 科 大 学 学         报                        2026年10月


              神经定向分化过程中神经祖细胞相关程序增强,而                            一步阐明上述神经分化阶段性失衡的分子机制,本
              后续成熟相关程序受阻。                                       研究首先进行了BID⁃seq检测(图5A),并对d3阶段
              2.5  Pus7 敲除通过 mRNA 假尿嘧啶化扰动神经连                    的 BID⁃seq 与 RNA⁃seq 数据进行联合分析。考虑到
              接相关基因程序                                           PUS7缺失可能导致部分靶转录本Ψ修饰水平下降,
                  假尿嘧啶化扰动神经连接相关基因程序为进                           而Ψ修饰降低可能进一步影响 mRNA 稳定性、加工

              A                                       B
                                                                  d 3              d 4               d 5
                        Transfer EBs
                                        N2B27
                      N2B27+1/4 2i     (⁃2i,⁃Lif)        WT
                   d0            d2   d3        d5                                     250 μm


              C                                          Pus7⁃KO

                   100                                                                                   500 μm
                                             Time(days)
                   75                          d0
                   50
                 (25.9%)  25 0                 d3     D  d0  Endoderm     Mesoderm   Ectoderm  Pluripotency  log2 FC
                                               d5
                 PC2  -25                    Group                                                     (KO/WT)
                   -50
                                               WT
                   -75                         KO       d3                                               2
                  -100                                                                                   0
                                                        d5
                  -100                                                                                   -2
                     -100  -75  -50  -25  0  25  50  75  75  100  Foxa2  Sox17  Afp  Cxcr4  Hhex  Gata4  Bmp4  T  Kdr  Mitf  Nodal  Eomes  Nes  Lhx2  Sox10  Pax6  Sox1  Klf4  Sox2  Nanog  Pou5f1  Myc
                             PC1(47.8%)
                E
                        WT                      WT                      WT                      WT
                                                Pus7⁃KO
                    4   Pus7⁃KO  **        1.5  ***                 4   Pus7⁃KO  *         1.5  Pus7⁃KO
                    Sox1 mRNA level  3 2 1  *  *  mRNA level  1.0  Sox17 mRNA level  3 2 1  mRNA level  Klf4 0.5
                                                                                           1.0

                                           0.5

                    0                      Bmp4  0                  0                       0
                        d0  d3   d5             d0   d3  d5             d0  d3  d5              d0  d3   d5
                         WT                     WT                      WT                      WT
                         Pus7⁃KO                Pus7⁃KO                 Pus7⁃KO                 Pus7⁃KO
                    10                     2.0                      3  ***                 1.5
                             ***
                    mRNA level  6  **      mRNA level  1.5  ***    mRNA level  2          mRNA level  1.0
                     8
                                           1.0
                    Pax6  4 2              Kdr  0.5                Gata4  1  *            Sox2 0.5

                     0                       0                      0                       0
                         d0  d3   d5            d0   d3  d5             d0  d3  d5              d0  d3   d5
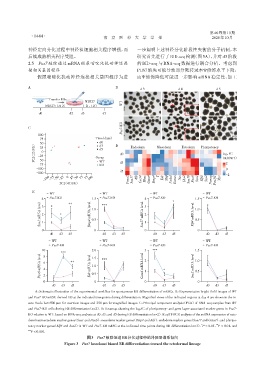
                 A:Schematic illustration of the experimental workflow for spontaneous EB differentiation of mESCs. B:Representative bright⁃field images of WT
              and Pus7⁃KO mESC⁃derived EB at the indicated time points during differentiation. Magnified views of the indicated regions at day 4 are shown in the in⁃
              sets. Scale bar=500 μm for overview images and 250 μm for magnified images. C:Principal component analysis(PCA)of RNA⁃seq samples from WT
              and Pus7⁃KO cells during EB differentiation(n=2). D:Heatmap showing the log 2FC of pluripotency⁃ and germ layer⁃associated marker genes in Pus7⁃
              KO relative to WT,based on RNA⁃seq analysis at d0,d3,and d5 during EB differentiation(n=2). E:qRT⁃PCR analysis of the mRNA expression of ecto⁃
              derm/neuroectoderm marker genes(Sox1 and Pax6),mesoderm marker genes(Bmp4 and Kdr),endoderm marker genes(Sox17 and Gata4),and pluripo⁃
                                                                                                     **
                                                                                              *
              tency marker genes(Klf4 and Sox2)in WT and Pus7⁃KO mESC at the indicated time points during EB differentiation(n=3). P < 0.05,P < 0.01,and
              ***
               P < 0.001.
                                         图3 Pus7敲除促进EB分化过程中的外胚层谱系倾向
                               Figure 3 Pus7 knockout biased EB differentiation toward the ectodermal lineage

