
Page 54 - 《南京医科大学学报》自然科学版2026年第2期
P. 54
第46卷第2期
·210 · 南 京 医 科 大 学 学 报 2026年2月
A B C
TBI
0.7 1.5
Sham 3 h 1 d 3 d 7 d 14 d *** ***
C3/α⁃Tubulin 0.5 S100A10/α⁃Tubulin
C3 115 kDa 0.6 1.0 **
S100A10 11 kDa 0.5
α⁃Tubulin 55 kDa 0.4
0.3 0
Sham 3 h 1 d 3 d 7 d 14 d Sham 3 h 1 d 3 d 7 d 14 d
TBI TBI
D E F * *
PBS LPS 2.0 PBS 1.0 * PBS
NC Dixdc1⁃sh NC Dixdc1⁃sh ** ** LPS 0.8 LPS
GFAP/α⁃Tubulin 1.0 C3/α⁃Tubulin
GFAP 50 kDa 1.5 ** 0.6
C3 115 kDa 0.4
S100A10 11 kDa 0.5 0.2
0 0
α⁃Tubulin 55 kDa NC NC NC NC
Dixdc1⁃sh Dixdc1⁃sh Dixdc1⁃sh Dixdc1⁃sh
G * I PBS LPS
2.0 ** PBS NC Dixdc1⁃sh NC Dixdc1⁃sh
LPS
S100A10/α⁃Tubulin 1.5 * C3
1.0
0.5
0 S100A10
Dixdc1⁃sh Dixdc1⁃sh
NC NC
H PBS LPS J PBS LPS K PBS
Dixdc1⁃sh Dixdc1⁃sh NC Dixdc1⁃sh NC Dixdc1⁃sh LPS *** *
NC NC p⁃STAT3 86 kDa 1.0
2.5 79 kDa 0.8
Serping 1 2.0 *
1.5 STAT3 79 kDa 0.6
specific H2.D1 1.0 p⁃STAT3/STAT3 0.4
A1 Gbp2 0.2
Srgn 0
NC
NC
S100A10 Dixdc1⁃sh Dixdc1⁃sh
specific Clcf1
A2
Emp1
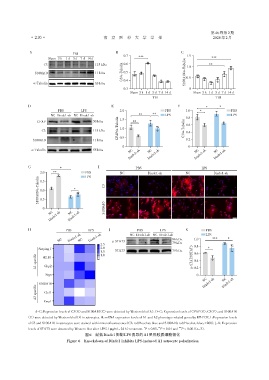
A-C:Expression levels of C3(B)and S100A10(C)were detected by Western blot(A). D-G:Expression levels of GFAP(E),C3(F),and S100A10
(G)were detected by Western blot(D)in astrocytes. H:mRNA expression levels of A1 and A2 phenotype⁃related genes by RT⁃PCR. I:Expression levels
of C3 and S100A10 in astrocytes were stained with immunofluorescence(C3:red/Hoechst:blue and S100A10:red/Hoechst:blue;×200). J,K:Expression
**
*
levels of STAT3 were detected by Western blot after LPS(1 μg/mL,24 h)treatment. P < 0.05,P < 0.01 and *** P < 0.001(n=3).
图6 敲低Dixdc1抑制LPS诱导的A1星形胶质细胞极化
Figure 6 Knockdown of Dixdc1 inhibits LPS⁃induced A1 astrocyte polarization