


Page 76 - 南京医科大学自然版
P. 76
第46卷第4期
               ·544 ·                            南 京    医 科 大 学 学         报                        2026年4月


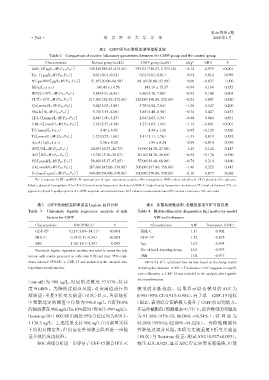
                                               表2 CSFP组与正常组血液学指标比较
                        Table 2 Comparison of routine laboratory parameters between the CSFP group and the control group
                      Characteristic       Normal group(n=42)     CSFP group(n=69)     z/t/χ 2  SMD       P
                GDF⁃15[ng/L,M(P25,P75)]   745.14(585.43,812.41)  957.01(716.27,1 373.16)  -4.14  0.979  <0.001
                Tn⁃Ⅰ[μg/L,M(P25,P75)]     000.01(0.01,0.01)     000.01(0.01,0.01)      -0.01    0.014    0.989
                NT⁃proBNP[pg/L,M(P25,P75)]  051.85(20.00,84.50)  048.10(20.00,95.90)    0.00   -0.037    1.000
                Hb(g/L,x ± s)                140.43 ± 14.56         143.19 ± 15.37     -0.94    0.184    0.352
                WBC[×10 /L,M(P25,P75)]    005.88(4.91,6.96)     006.40(4.76,7.80)      -0.52    0.108    0.605
                       9
                PLT[×10 /L,M(P25,P75)]    217.50(182.50,272.50)  226.00(190.00,252.00)  -0.23   0.007    0.820
                      9
                Glu[mmol/L,M(P25,P75)]    005.42(5.03,5.80)     005.70(4.92,7.04)      -1.06    0.547    0.290
                Hba1c[%,M(P25,P75)]       005.70(5.55,6.08)     005.85(5.40,6.50)      -0.74    0.427    0.457
                LDL⁃C[mmol/L,M(P25,P75)]  002.48(1.90,3.25)     002.64(2.03,3.34)      -0.48    0.064    0.631
                HDL⁃C[mmol/L,M(P25,P75)]  003.62(2.57,4.54)     001.27(1.05,1.64)      -7.15   -1.891   <0.001
                TC(mmol/L,x ± s)              04.47 ± 0.93           04.34 ± 1.06       0.65   -0.128    0.520
                TG[mmol/L,M(P25,P75)]     001.23(0.75,1.60)     001.41(1.11,1.76)      -1.33    0.019    0.182
                ApoA1(g/L,x ± s)              01.56 ± 0.20           01.55 ± 0.24       0.05   -0.010    0.956
                AST[U/L,M(P25,P75)]       020.45(16.33,26.75)   019.00(14.30,27.00)    -1.45    0.144    0.147
                ALT[U/L,M(P25,P75)]       019.70(15.30,29.87)   020.10(14.70,26.60)    -0.54   -0.176    0.590
                SCr[μmol/L,M(P25,P75)]    056.60(45.37,67.85)   057.00(49.40,68.00)    -0.74    0.214    0.460
                UA[mmol/L,M(P25,P75)]     287.00(245.00,338.00)  306.00(267.00,356.00)  -1.46   0.225    0.145
                D⁃dimer[ng/mL,M(P25,P75)]  340.00(290.00,370.00)  300.00(270.00,350.00)  -2.10  0.077    0.036
                 Tn⁃I:troponin I;NT⁃proBNP;N⁃terminal pro B⁃type natriuretic peptide;Hb:hemoglobin;WBC:white blood cell;PLT:platelet;Glu:glucose;
              Hba1c:glycated hemoglobin A1c;LDL⁃C:low⁃density lipoprotein cholesterol;HDL⁃C:high⁃density lipoprotein cholesterol;TC:total cholesterol;TG:tri⁃
              glyceride;ApoA1:apolipoprotein A1;AST:aspartate aminotransferase;ALT:alanine aminotransferase;SCr:serum creatinine;UA:uric acid.

                  表3 CSFP危险因素的单因素Logistic回归分析                        表4  多重共线性诊断:全模型逐项VIF与容忍度
              Table 3  Univariate logistic regression analysis of risk  Table 4 Multicollinearity diagnostics:full model⁃by⁃model
                       factors for CSFP                                 VIF and tolerance
                 Characteristic    OR(95%CI)         P                 Characteristic    VIF    Tolerance(1/VIF)
                 GDF⁃15 a        10.27(3.09-34.11)  <0.001        HDL⁃C                  1.11        0.902
                 HDL⁃C           00.19(0.11-0.34)  <0.001         GDF⁃15 a               1.12        0.895
                 BMI             01.16(1.01-1.34)   0.043         Age                    1.01        0.994
                 Univariate logistic regression analysis was used to assess the risk  Use of lipid⁃lowering drugs  1.01  0.993
              factors,with results presented as odds ratio(OR)and their 95% confi⁃  BMI  1.02        0.977
                                                                            2
              dence interval(95%CI). a:GDF⁃15 was included in the analysis after  VIF=1/(1-R ),calculated item by item based on the design matrix
              logarithmic transformation.                        including the intercept. A VIF < 5(tolerance > 0.2)suggests no signifi⁃
                                                                 cant collinearity. a:GDF⁃15 was included in the analysis after logarith⁃
             (cut⁃off)为 908 ng/L,对应的灵敏度 57.97%、特异                mic transformation.
              度 90.48%。为降低过拟合风险,对该阈值进行内                         模型的诊断效能。结果显示联合模型的 AUC 为
              部验证:重复 5 折交叉验证(10 次)显示,各训练折                       0.953(95% CI:0.913~0.984),高于单一GDF⁃15指标

              中重新选定的阈值中位数为 946.8 ng/L,且有78.0%                  (图2),表明联合策略极大提升了CSFP的识别能力。
              的阈值落在908 ng/L的±10%区间(即817~999 ng/L);              在最佳截断值(预测概率=0.73)下,联合模型的灵敏度

              Bootstrap(B=1 000)给出阈值95%分位区间为839.3~              为 91.30%(95% CI:86.06% ~96.54% ),特 异 度 为
              1 138.3 ng/L。上述结果支持908 ng/L在内部重采样                 88.10%(95%CI:82.08%~94.12%)。为检验稳健性
              下的相对稳定性,但仍需在外部独立队列进一步验                            并降低过拟合风险,本研究实施重复 5 折交叉验证
              证并视情况再校准。                                        (10 次)与 Bootstrap 校正:测试 AUC(0.927±0.053),

                  ROC曲线分析进一步评估了GDF⁃15联合HDL⁃C                    校正AUC 0.925,显示AUC存在轻度乐观偏倚,但联

