Page 38 - 南京医科大学自然版
P. 38

第46卷第5期
              ·660 ·                             南 京    医 科 大 学 学         报                        2026年5月


              2.5  小鼠胃癌模型探究 PTPN6 对肿瘤生长和 NK                     建立皮下移植瘤模型。结果显示,在 NCG 小鼠中,
              细胞浸润的调控作用                                         PTPN6过表达对肿瘤生长无显著影响(图5B);而在
                  本研究进一步在小鼠胃癌细胞系 YTN16 中构                       C57BL/6 小鼠中,PTPN6 的过表达显著促进了肿瘤
              建了 PTPN6 稳定过表达细胞株(图 5A),并在 NCG                    生长(图5C),提示PTPN6可能通过免疫调节机制促
              鼠(免疫缺陷鼠)和C57BL/6鼠(免疫正常鼠)中分别                       进肿瘤进展。流式细胞术检测小鼠肿瘤组织中NK

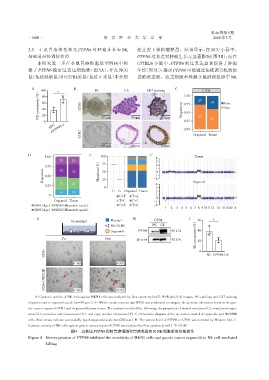
                A   100     *      B         BF           HE         CK7 staining  C          GTO1
                   (%)  80                                                            1.00  27
                   NK cytotoxicity  60  GTO1                                         Proportions  0.75  39  False

                                                                                                        True
                    40
                                                                                      0.50
                    20
                     0                          50 μm         50 μm        50 μm      0.25  73    61
                         siPTPN6⁃1
                        siNC                                                          0.00
                                      GTO2                                                Organoid Tissue


                                                50 μm         50 μm        50 μm
              D                           E                           F
                      1.00                     100                                         Tissue
                                                                         4
                            20    20                                     3
                      0.75  32                 (%)  75                   2 1
                     Exposures  0.50  36       Mutations  50            -1 0
                                                                        -2
                                                25
                            33    29                                     4                Organoid
                      0.25
                                                 0                       3
                                                     Ti Tv Organoid Tissue  2
                            14    16
                        0                               C>T   T>A        1
                                                                         0
                          Organoid Tissue               T>C   C>G       -1
                 SBS1(Age) SBS15(Mismatch repair)       C>A   T>G       -2
                 SBS5(Age) SBS20(Mismatch repair)                            1  2  3 4 5 6 7 8 9101112 14 161820 X
                  G                                           H                         I
                                  On matrigel       Matrigel            GTO1                60     *
                                                    NK⁃92⁃MI           NC OE               (%)
                                                    Organoids    PTPN6          68 kDa      40
                              Pre                Post           β⁃actin         42 kDa     NK cytotoxicity  20


                      GCOs                                                                   0  NC PTPN6⁃OE


                                   0∶00                4∶00
                      GCOs+NK92MI


                                   0∶00
                                                       4∶00
                 A:Cytotoxic activity of NK cells against MKN1 cells was analyzed by flow cytometry(n=3). B:Bright⁃field images,HE staining,and CK7 staining
              of gastric cancer organoids,scale bar=50 μm. C-F:Whole⁃exome sequencing(WES)was performed to compare the genomic alterations between the gas⁃
              tric cancer organoid GTO1 and its parental tumor tissue. The analysis included the following:the proportion of shared mutations(C),mutational signa⁃
              tures(D),transition and transversion(E),and copy number alterations(F). G:Schematic diagram of the co⁃culture model of organoids and NK92MI
              cells. Red arrows indicate successfully lysed organoids(scale bar=200 μm). H:The protein level of PTPN6 in GTO1 was detected by Western blot. I:
                                                                                 *
              Cytotoxic activity of NK cells against gastric cancer organoid GTO1 was analyzed by flow cytometry(n=3). P < 0.05.
                                  图4   过表达PTPN6抑制胃癌细胞和胃癌类器官对NK细胞杀伤的敏感性
              Figure 4  Overexpression of PTPN6 inhibited the sensitivity of MKN1 cells and gastric cancer organoids to NK cell⁃mediated
                      killing
   33   34   35   36   37   38   39   40   41   42   43