


Page 43 - 南京医科大学自然版
P. 43
第46卷第6期             朱天帆,陈     峰,黄惠结. SMOC2促进低氧诱导的肺血管平滑肌细胞表型转换[J].
                  2026年6月                      南京医科大学学报(自然科学版),2026,46(6):820-831                      ·825  ·


                A                                          B               P<0.001  NC                P<0.001  NC
                                                                          P<0.001  siS1              P<0.001  siS1
                                                               2.0                ▲ siS2   2.0              ▲ siS2
                                                                     P<0.001
                                                                                                 P<0.001
                                                                   P<0.001                    P<0.001
                               Normoxia  Hypoxia               1.5                         1.5
                                                              SMOC2/β⁃actin   ▲ ▲
                              NC  siS1  siS2  NC  siS1  siS2   1.0  P<0.001               PCNA/Tubulin  1.0  P<0.001  ▲ ▲ ▲
                                                                              ▲
                      SMOC2                      -54 kDa              ▲  ▲                        ▲ ▲
                                                                                                  ▲
                      β⁃actin                    -43 kDa       0.5                         0.5
                                                                0                           0
                                                                  Normoxia  Hypoxia           Normoxia  Hypoxia
                       PCNA                      -36 kDa
                                                                     P<0.001
                      Tubulin                    -55 kDa                          NC                         NC
                                                                   P<0.001
                                                                                  siS1           P<0.001     siS1
                      α⁃SMA                      -42 kDa       2.5  P<0.001       ▲ siS2   2.5              ▲ siS2
                                                                                              P<0.001
                                                                                                      P<0.001
                      Tubulin                    -55 kDa       2.0     ▲ ▲  P=0.001        2.0 P<0.001 ▲  P<0.001
                                                              αSMA/Tubulin    ▲ ▲         Calponin/Tubulin  ■
                                                                                                 ■
                     Calponin1                   -32 kDa       1.5     ▲  P=0.005 ▲        1.5  ■ ■ ▲ ▲ ▲  ■ ■  ▲ ▲ ▲
                      Tubulin                    -55 kDa       1.0                         1.0
                                                               0.5                         0.5
                                                                0                           0
                                                                  Normoxia  Hypoxia           Normoxia  Hypoxia
                C
                                          Normoxia                                   Hypoxia
                             NC           siS1           siS2           NC           siS1           siS2


                      h
                      0


                      h
                      24
                                                                                                       1 000 μm

                D                 P<0.001  E                                            F
                    NC                                                                                P<0.001
                                                    NC           siS1          siS2
                    siS1          P<0.001                                                                    NC
                                                                                                     P<0.001
                   ▲ siS2  40  P<0.001                                                     30    P<0.001     ▲ siS2
                                                                                                             siS1
                           P<0.001
                      (%)  30  P<0.001  ■ ■ ■  ▲  ▲  Normoxia                             (%)  20 P<0.001  ■ ■  ▲  ▲
                                                                                               P=0.003
                      Migration rate  20  ■ ■ ■  ▲ ▲  ▲  ▲  Hypoxia                       EdU positive cells  10  ■ ■ ■ ■ ■ ■  ▲  ▲  ▲  ▲  ▲▲  ■ ■  ▲ ▲  ▲  ▲
                                                                                                         ■ ■
                                                                                                 ■
                       10
                        0                                                         400 μm    0
                          Normoxia  Hypoxia                                                   Normoxia  Hypoxia
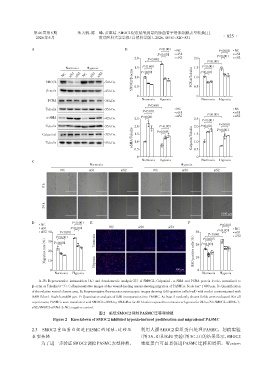
                   A,B:Representative immunoblots(A)and densitometric analysis(B)of SMOC2,Calponin1,α⁃SMA and PCNA protein levels,normalized to
                β⁃actin or Tubulin(n=3). C:Representative images of the wound⁃healing assays showing migration of PASMCs. Scale bar=1 000 μm. D:Quantification
                of the relative wound closure area. E:Representative fluorescence microscopic images showing EdU⁃positive cells(red)with nuclei counterstained with
                DAPI(blue). Scale bar=400 μm. F:Quantitative analysis of EdU incorporation into PASMC. At least 5 randomly chosen fields were evaluated. For all
                experiments,PASMCs were transfected with SMOC2 siRNA by RNAiMax for 48 h before exposed to normoxia or hypoxia for 24 h,siS1:SMOC2⁃siRNA⁃1;
                siS2:SMOC2⁃siRNA⁃2,NC:negative control.
                                               图2 敲低SMOC2抑制PASMC迁移和增殖
                          Figure 2  Knockdown of SMOC2 inhibited hypoxia⁃induced proliferation and migrationof PASMC


                2.3  SMOC2 重组蛋白促进 PASMC 的增殖、迁移及                   利用人源 SMOC2 重组蛋白处理 PASMC。划痕实验
                表型转换                                             (图3A、B)和EdU实验(图3C、D)的结果显示,SMOC2
                    为了进一步验证SMOC2调控PASMC表型转换,                      重组蛋白可显著促进PASMC迁移和增殖。Western

