


Page 87 - 南京医科大学自然版
P. 87
第46卷第7期      何加芹,刘新亮,魏 琼,等. 基于加速康复外科理念的多学科协作模式在糖尿病神经源性膀胱患者
                  2026年7月           管理中的应用[J]. 南京医科大学学报(自然科学版),2026,46(7):1029-1036,1045                ·1033 ·


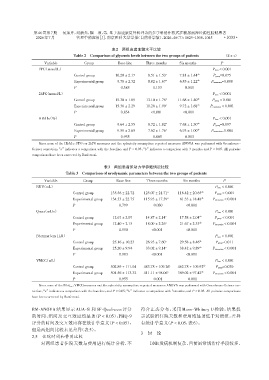
                                                     表2 两组患者血糖水平比较
                                   Table 2 Comparison of glycemic levels between the two groups of patients  (x ± s)

                     Variable           Group           Base line   Three months    Six months         P
                   FPG(mmol/L)                                                                     Ptime < 0.001
                                   Control group      10.20 ± 2.17  08.51 ± 1.53 a  07.81 ± 1.44 ab  Pgroup=0.075
                                   Experimental group  09.78 ± 2.32  08.02 ± 1.67 a  06.85 ± 1.22 ab  Pinteraction=0.088
                                   P                     0.385         <0.153         <0.001
                   2hPG(mmol/L)                                                                    Ptime < 0.001
                                                                              a             ab
                                   Control group      15.30 ± 1.89  13.10 ± 1.78   11.68 ± 1.40    Pgroup < 0.001
                                   Experimental group  15.38 ± 2.29  11.28 ± 1.90 a  09.72 ± 1.68 ab  Pinteraction < 0.001
                                   P                     0.854         <0.001         <0.001
                   HBA1c(%)                                                                        Ptime < 0.001
                                   Control group      09.64 ± 2.55  08.72 ± 1.82 a  07.68 ± 1.30 ab  Pgroup=0.097
                                   Experimental group  09.59 ± 2.65  07.62 ± 1.76 a  06.93 ± 1.00 ab  Pinteraction=0.004
                                   P                     0.935         <0.005         <0.003
                   Since none of the HbA1c,FPG,or 2hPG measures met the sphericity assumption,repeated measures ANOVA was performed with Greenhouse⁃
                Geisser correction;“a”indicates a comparison with the baseline,and P < 0.05;“b”indicates a comparison with 3 months,and P < 0.05. All pairwise
                comparisons have been corrected by Bonferroni.

                                                 表3   两组患者尿动力学参数情况比较
                               Table 3 Comparison of urodynamic parameters between the two groups of patients

                     Variable          Group           Base line     Three months     Six months        P
                  RUV(mL)                                                                           Ptime < 0.001
                                   Control group    135.56 ± 22.720  125.07 ± 21.71 a  118.42 ± 20.65 ab  Pgroup < 0.001
                                   Experimental group  134.33 ± 22.750  115.93 ± 17.39 a  081.33 ± 18.48 ab  Pinteraction < 0.001
                                   P                    0.799          <0.030          <0.001
                  Qmax(mL/s)                                                                        Ptime < 0.001
                                   Control group     12.67 ± 2.070  014.87 ± 2.14 a  017.58 ± 2.04 ab  Pgroup < 0.001
                                   Experimental group  12.40 ± 2.150  018.09 ± 2.26 a  021.67 ± 2.33 ab  Pinteraction < 0.001
                                   P                    0.550          <0.001          <0.001
                  Pdetmax(cm H2O)                                                                   Ptime < 0.001
                                   Control group     25.16 ± 10.23  026.93 ± 7.60 a  029.58 ± 8.46 ab  Pgroup=0.011
                                                                             a               ab
                                   Experimental group  25.20 ± 9.940  033.02 ± 9.14  038.42 ± 9.89  Pinteraction < 0.001
                                   P                    0.983          <0.001          <0.001
                  VMCC(mL)                                                                          Ptime < 0.001
                                   Control group    502.89 ± 111.04  483.78 ± 109.26 a  462.78 ± 109.92 ab  Pgroup=0.030
                                   Experimental group  501.56 ± 113.32  411.11 ± 98.06 a  389.02 ± 97.42 ab  Pinteraction < 0.001
                                   P                    0.955          <0.001          <0.001
                   Since none of the Pdet max,VMCCmeasures met the sphericity assumption,repeated measures ANOVA was performed with Greenhouse⁃Geisser cor⁃
                rection;“a”indicates a comparison with the baseline,and P < 0.05;“b”indicates a comparison with 3 months,and P < 0.05. All pairwise comparisons
                have been corrected by Bonferroni.

                RM⁃ANOVA 结果显示 AUA⁃SI 和 SF⁃Qualiveen 评分            符合正态分布,采用 Mann⁃Whitney U 检验,结果提

                的时间、组间及交互效应均显著(P < 0.05),PHQ⁃9                    示试验组住院天数和费用均显著低于对照组,差异
                评分的时间及交互效应存在统计学意义(P < 0.05),                      有统计学意义(P < 0.05,表6)。
                但是两组间比较未见差异(表5)。
                                                                  3 讨 论
                2.5  住院时间和费用比较
                    对两组患者住院天数与费用进行统计分析,不                              DNB发病机制复杂,目前虽常规治疗手段较多,

