


Page 134 - 南京医科大学自然版
P. 134
第45卷第6期
               ·872 ·                            南 京    医 科 大 学 学         报                        2025年6月


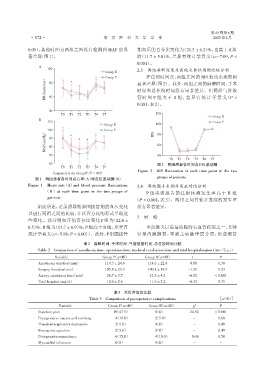
              0.05),其他时间点两组之间没有检测到 MAP 的显                       期血压的百分比变化为(21.3 ± 6.2)%,也高于 R 组
              著差异(图1)。                                          的(11.7 ± 5.8)%,差异有统计学意义(t=-7.09,P <
                                                                0.001)。
                   A
                       100                                           两组麻醉深度及其他次要结局的比较分析
                                                  Group R       2.3  在任何时间点,两组之间的 BIS 值均未观察到
                                                  Group P
                      (beats/mm)  80  *                         显著差异(图2)。此外,两组之间的麻醉时间、手术
                                                                时间和总住院时间没有显著差异。但两组气管拔

                      HR  60                                    管时间 P 组大于 R 组,差异有统计学意义(P <
                                                                0.001,表2)。

                        40
                             T0  T1  T2  T3  T4  T5                      120
                                                                                                   Group R
                   B
                       110                                                                         Group P
                                                 Group R                 100
                                                 Group P
                      (mmHg) 100  *  *   *                              BIS  80
                        90
                      MAP  80                                             60
                        70                                                40
                                                                               T0  T1  T2  T3  T4  T5
                        60                                                图2 两组患者各时间点BIS波动图
                             T0  T1  T2  T3  T4  T5
                                                                 Figure 2  BIS fluctuation at each time point in the two
                                          *
                          Compared to the Group P,P < 0.05.
                                                                         groups of patients
                 图1   两组患者各时间点心率(A)和血压波动图(B)
              Figure 1  Heart rate(A)and blood pressure fluctuations  2.4  两组围手术期并发症对比分析
                      ( B)at each time point in the two groups of    P 组患者报告的注射疼痛发生率高于 R 组
                       patients
                                                               (P < 0.001,表 3)。两组之间其他并发症的发生率
                  如前所述,记录诱导期和围拔管期的血压变化                          没有显著差异。
              以进行两组之间的比较,并以百分比的形式呈现这
                                                                3  讨 论
              些变化。诱导期血压的百分比变化 P 组为(22.6 ±
              6.5)%,R 组为(13.7 ± 6.9)%,P 组高于 R 组,差异有                  主动脉夹层是最危险的心血管疾病之一,其特
              统计学意义(t=-5.98,P < 0.001)。此外,P组围拔管                 征是内膜撕裂,导致主动脉壁层分离,形成假管

                                        表2 麻醉时间、手术时间、气管拔管时间、总住院时间比较
                  Table 2 Comparison of anesthesia time,operation time,tracheal extubation time and total hospitalization time(x ± s)

                          Variable              Group P(n=40)       Group R(n=40)         t           P
                   Anesthesia duration(min)      119.3 ± 24.6        114.6 ± 22.8       -0.88         0.380
                   Surgery duration(min)         105.8 ± 23.3        100.1 ± 18.5       -1.21         0.230
                   Airway extubation time(min)    26.7 ± 3.7          21.3 ± 4.2        -6.02       < 0.001
                   Total hospital stay(d)         12.0 ± 2.6          11.9 ± 2.2        -0.33         0.750


                                                      表3 术后并发症比较
                                          Table 3  Comparison of postoperative complications          [n(%)]
                            Variable               Group P(n=40)      Group R(n=40)       χ 2         P
                   Injection pain                    19(47.5)            0(0)00.         24.92      < 0.001
                   Postoperative nausea and vomiting  04(10.0)           2(5.0)0          -           0.680
                   Transient respiratory depression   2(5.0)             0(0)00.          -           0.490
                   Emergence agitation                2(5.0)             0(0)00.          -           0.490
                   Postoperativesomnolence           06(15.0)            4(10.0)         00.46        0.500
                   Myocardial infarction              0(0).0             0(0)00.          -           -

