


Page 108 - 南京医科大学自然版
P. 108
第45卷第8期
               ·1164 ·                           南 京    医 科 大 学 学         报                        2025年8月


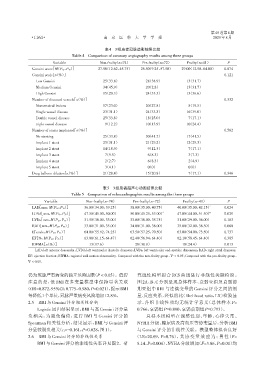
                                                 表4   3组患者冠脉造影结果比较
                                  Table 4 Comparison of coronary angiography results among three groups
                         Variable              Non⁃frailty(n=74)   Pre⁃frailty(n=72)   Frailty(n=41)      P
                Gensini score[M(P25,P75)]     27.50(12.62,45.75)  26.50(9.25,57.50)  29.00(12.50,84.00)  0.874
                Gensini scale[n(%)]                                                                      0.121
                  Low Gensini                 00.25(33.8)         00.28(38.9)        00.13(31.7)
                  Medium Gensini              00.34(45.9)         00.20(2.8)         00.13(31.7)
                  High Gensini                00.15(20.3)         00.24(33.3)        00.15(36.6)
                Number of diseased vessels[n(%)]                                                         0.332
                  Nonsensical lesions         00.17(23.0)         00.20(27.8)        00.08(19.5)
                  Single vessel disease       00.23(31.1)         00.24(33.3)        00.16(39.0)
                  Double vessel disease       00.25(33.8)         00.18(25.0)        00.07(17.1)
                  triple vessel disease       00.09(12.2)         00.10(13.9)        00.10(24.4)
                Number of stents implanted[n(%)]                                                         0.582
                  No stenting                 00.25(33.8)         00.30(41.7)        00.17(41.5)
                  Implant 1 stent             00.23(31.1)         00.21(29.2)        00.12(29.3)
                  Implant 2 stent             00.14(18.9)         00.09(12.5)        00.07(17.1)
                  Implant 3 stent             00.07(9.5)          00.06(8.3)         00.03(7.3)
                  Implant 4 stent             00.02(2.7)          00.06(8.3)         00.02(4.9)
                  Implant 5 stent             00.03(4.1)          00.00(0)           00.00(0)
                Drug balloon dilation[n(%)]   00.21(28.4)         00.15(20.8)        00.07(17.1)         0.346


                                                 表5  3组患者超声心动图结果比较
                                  Table 5 Comparison of echocardiographic results among the three groups
                     Variable            Non⁃frailty(n=74)    Pre⁃frailty(n=72)      Frailty(n=41)        P
                LAD[mm,M(P25,P75)]      36.00(34.00,39.25)   38.00(35.00,40.75)    40.00(35.00,42.15) *  0.024
                LDVd[mm,M(P25,P75)]     47.50(45.00,50.00)   50.00(45.25,53.00) *  47.00(44.00,51.50) #  0.029
                LVDs[mm,M(P25,P75)]     31.50(30.00,33.00)   33.00(30.00,35.75)    31.00(29.00,36.00)    0.183
                RAD[mm,M(P25,P75)]      33.00(31.00,35.00)   34.00(31.00,36.00)    35.00(32.00,36.50)    0.060
                E[cm/s,M(P25,P75)]      64.00(55.92,74.25)   63.50(57.25,70.50)    63.00(54.00,73.50)    0.737
                EF[%,M(P25,P75)]        63.00(61.15,64.47)   62.40(56.94,64.40)    62.10(58.45,64.40)    0.385
                RWMA[n(%)]              00.13(17.6)          00.28(38.9)           00.10(24.4)           0.013
                 LAD:left anterior descendin;LVDd:left ventricular diastolic diameter;LVDs:left ventricular end⁃systolic dimension;RAD:right atrial diameter;
              EF:ejection fraction;RWMA:regional wall motion abnormality. Compared with the non⁃frailty group,P < 0.05;Compared with the pre⁃frailty group,
                                                                                *
              #
              P < 0.05.

              仍为冠脉严重病变的独立危险因素(P < 0.05)。值得                      究线性模型拟合 RCS 曲线进行非线性关联检验。
              注意的是,低 BMI 在多变量模型中保持显著关联                          图 2A、B、C 分别呈现总体样本、衰弱亚组及衰弱前

             (OR=0.872,95%CI:0.775~0.980,P=0.021),提示BMI         期亚组中 BMI 与连续变量的 Gensini 评分之间的剂
              每降低1个单位,冠脉严重病变风险增加12.8%。                          量⁃反应关系,经似然比(likelihood ratio,LR)检验显

              2.5  BMI与Gensini评分相关性分析                           示,各组非线性项均无统计学意义(总体样本 P=
                  Logistic回归结果显示,BMI与高Gensini评分呈                0.766,衰弱组P=0.890,衰弱前期组P=0.793)。
              负相关,为避免偏倚,进行 BMI 与 Gensini 评分的                         总样本组模型在调整性别、年龄、心律失常、
              Spearman 相关性分析,结果显示,BMI 与 Gensini 评               NYHA分级、糖尿病及高血压等协变量后,分析BMI
              分呈较弱负相关(rs=-0.161,P=0.028,图1)。                    与 Gensini 评分的非线性关联。模型整体拟合良好

              2.6  BMI与Gensini评分的非线性关系                         (LR=20.69,P=0.76),其协变量效应为:男性(F=
                  BMI与Gensini评分的非线性关系详见图2。研                     8.14,P=0.004),NYHA分级增加(F=3.86,P=0.01)均

